

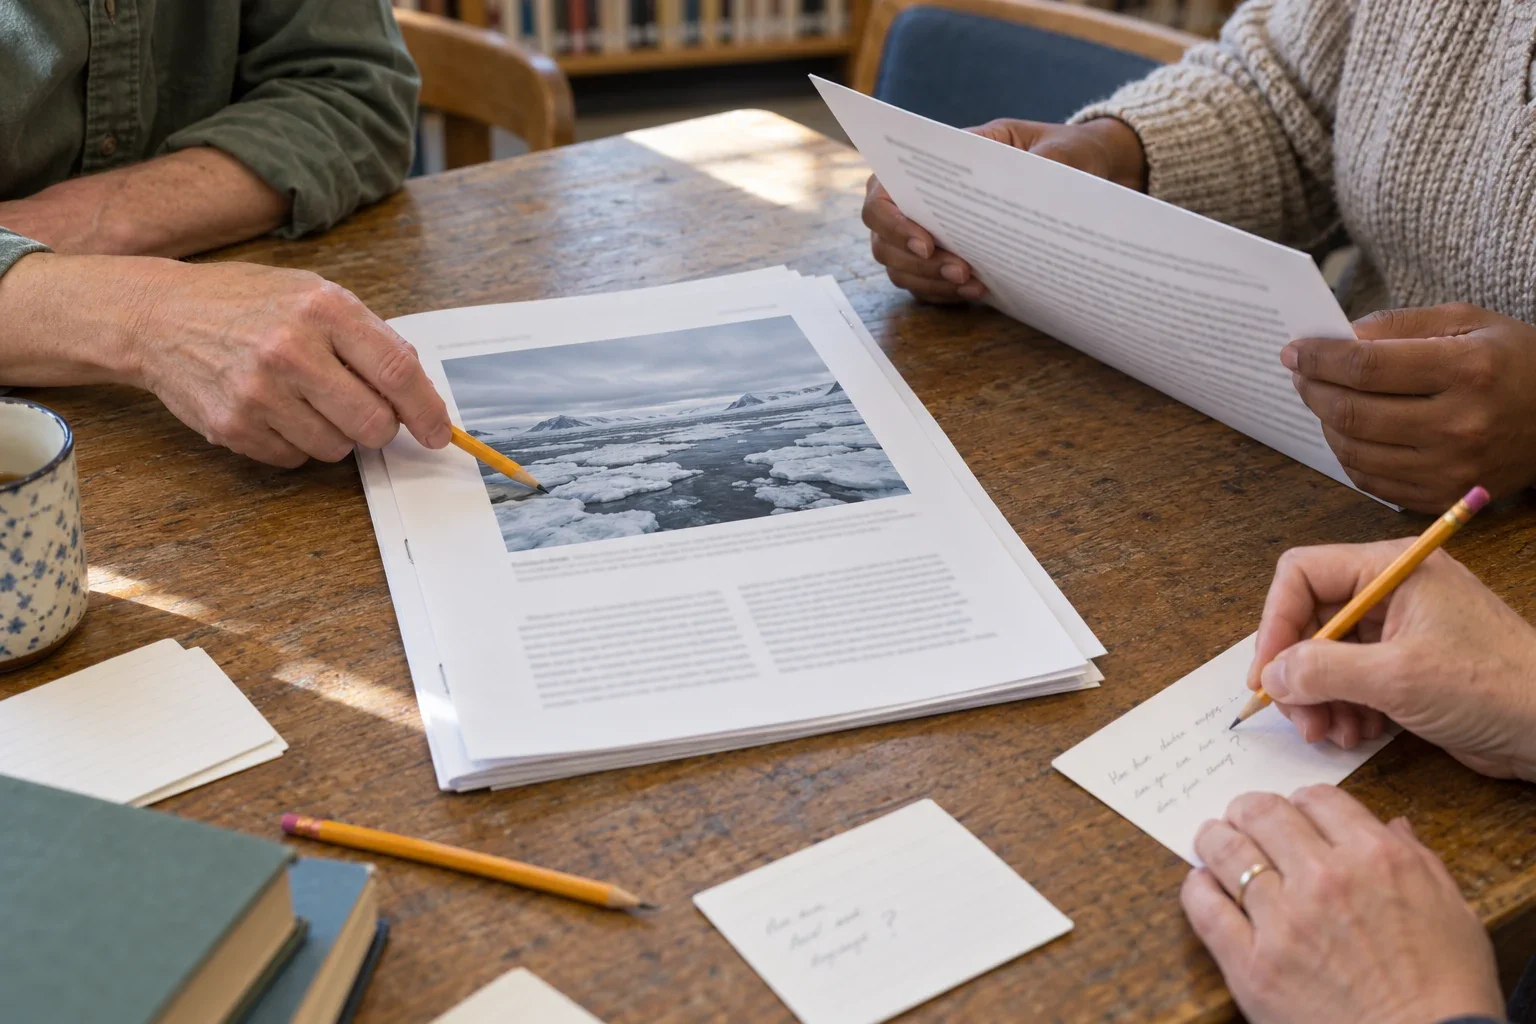
An evidence session with room for a better question
Design a school or community session around one source, a testable claim, accessible participation, and a traceable answer rather than a roomful of pledges.
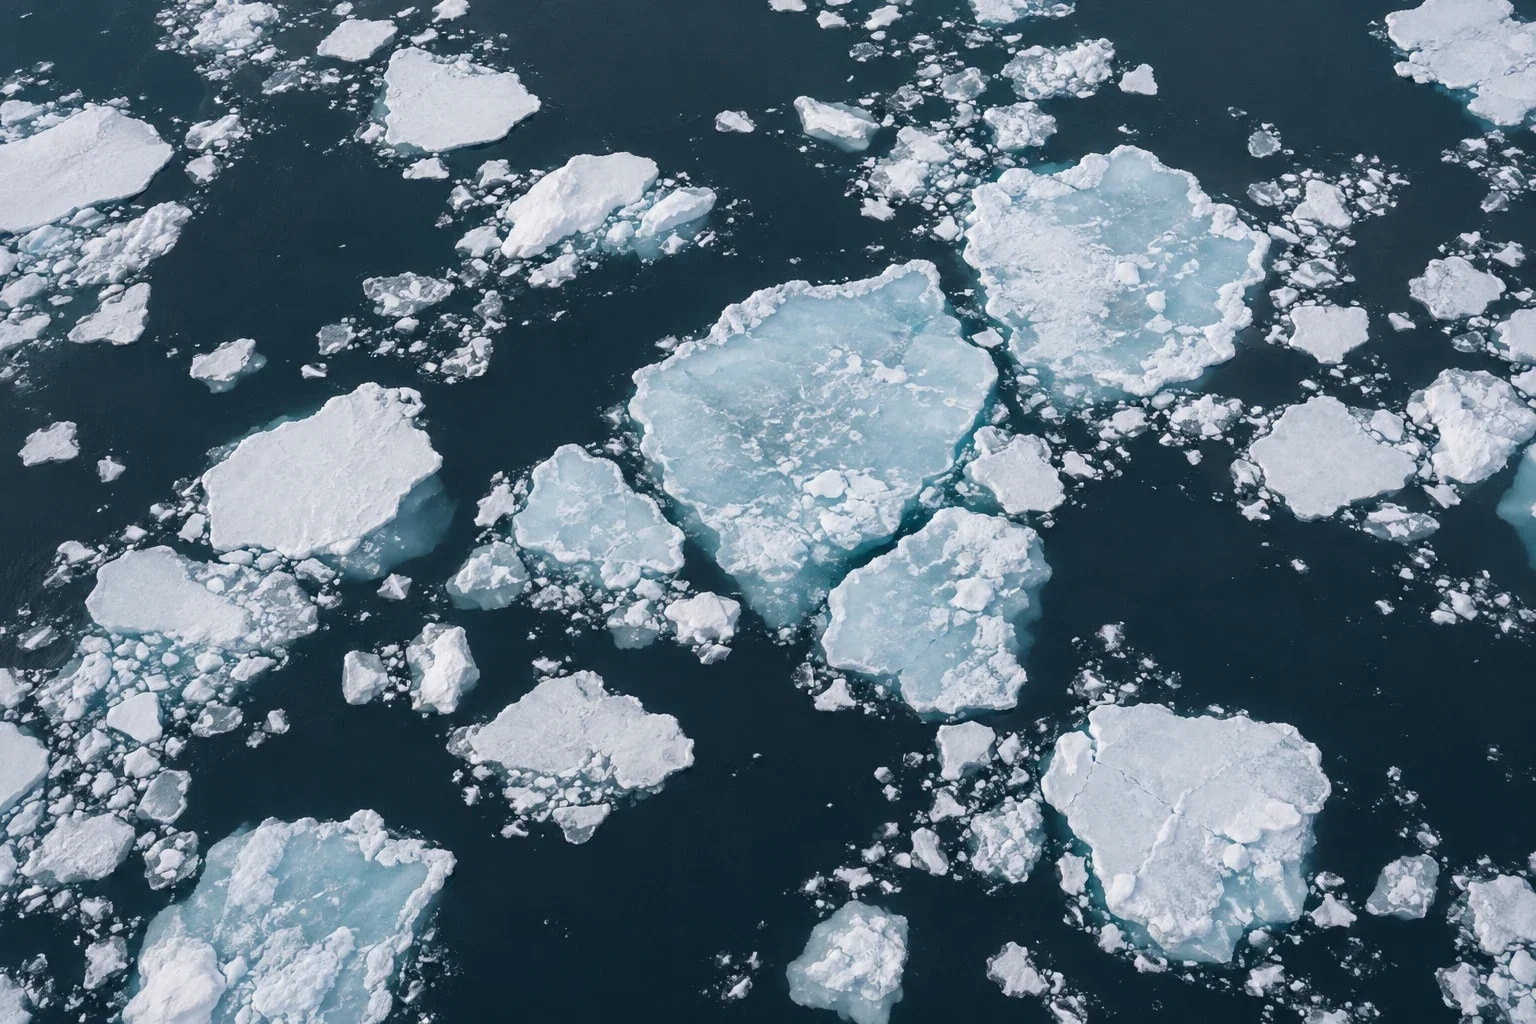
Read the Arctic Report Card beyond the headlines
Follow a headline into its definition, table, calendar, and method, from daily sea ice minima to the limits of an observing-network assessment.
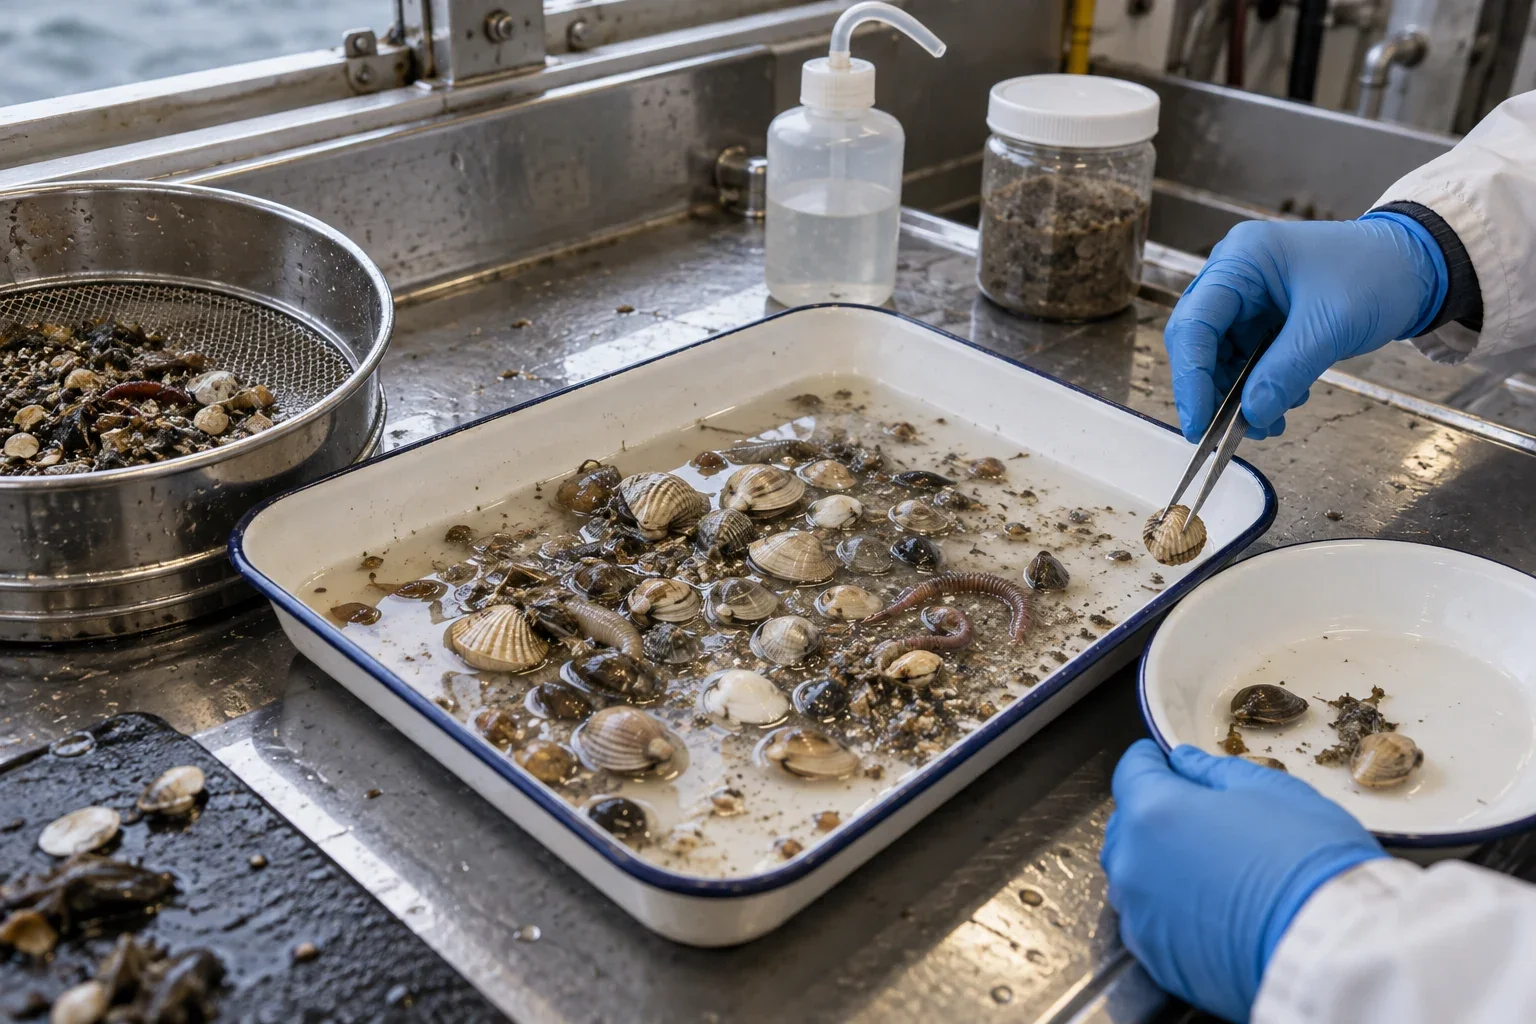
Testing a changing Arctic food web
A Bering and Chukchi Sea synthesis tests borealization against a different food-web mechanism. Mixed species responses, sampling gaps, and an exceptional first year sharpen the conclusion.
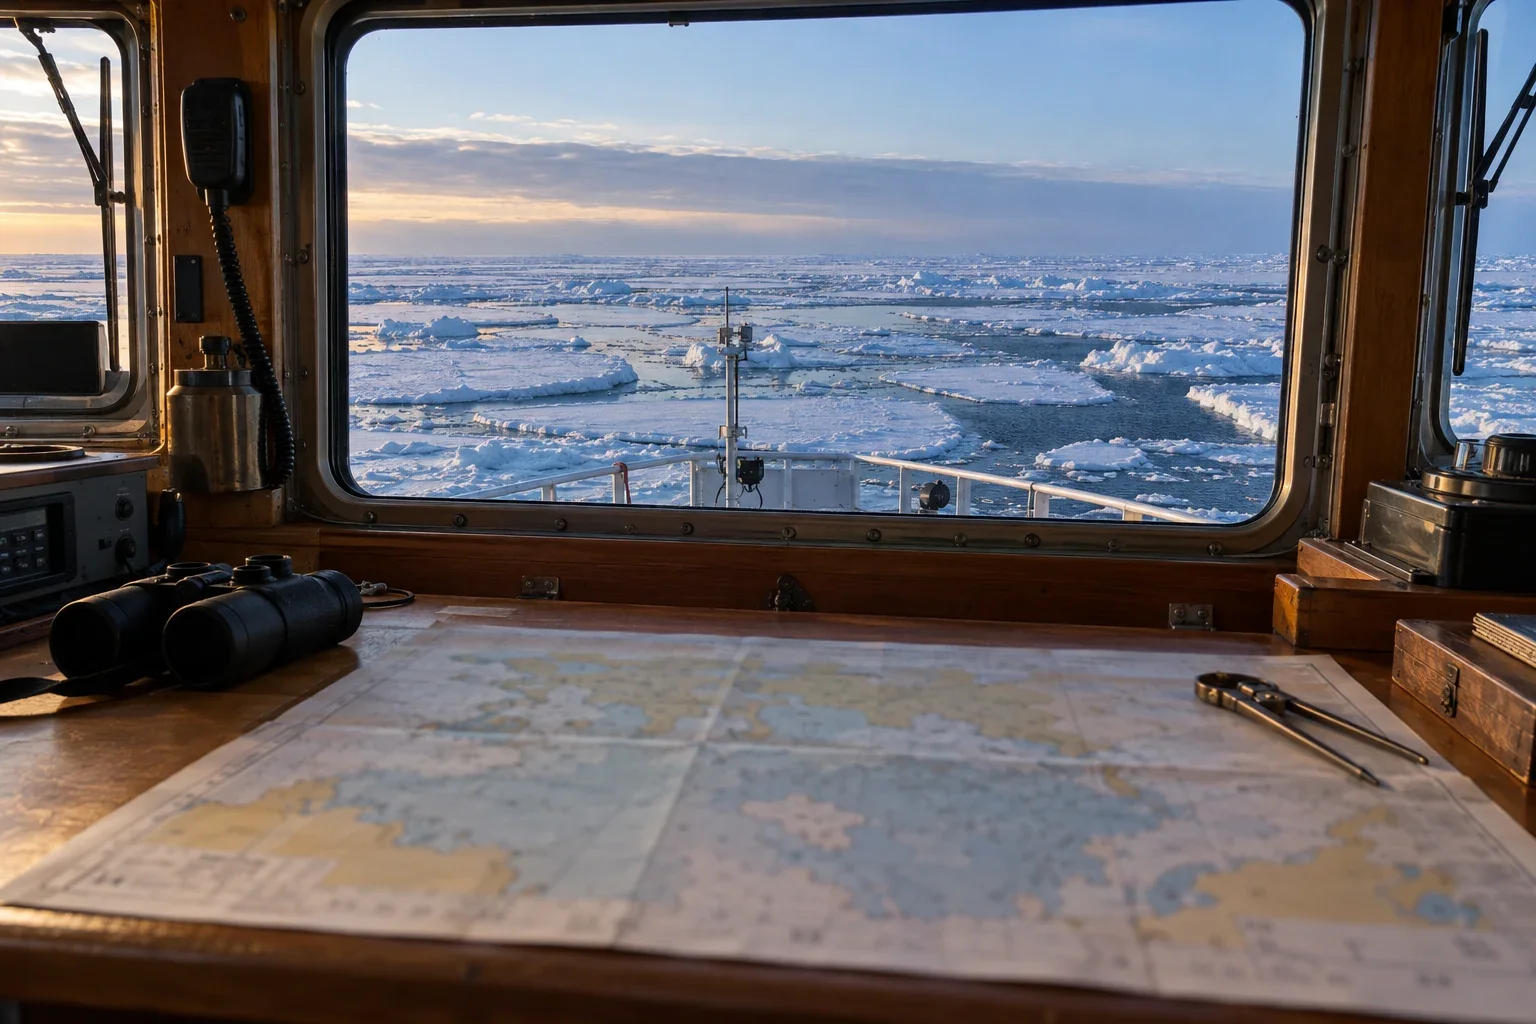
What an ice chart cannot promise
Valid times, egg codes, partial concentrations, and chart coverage matter. Learn why a regional ice analysis cannot guarantee route connectivity, local strength, or a safe journey.
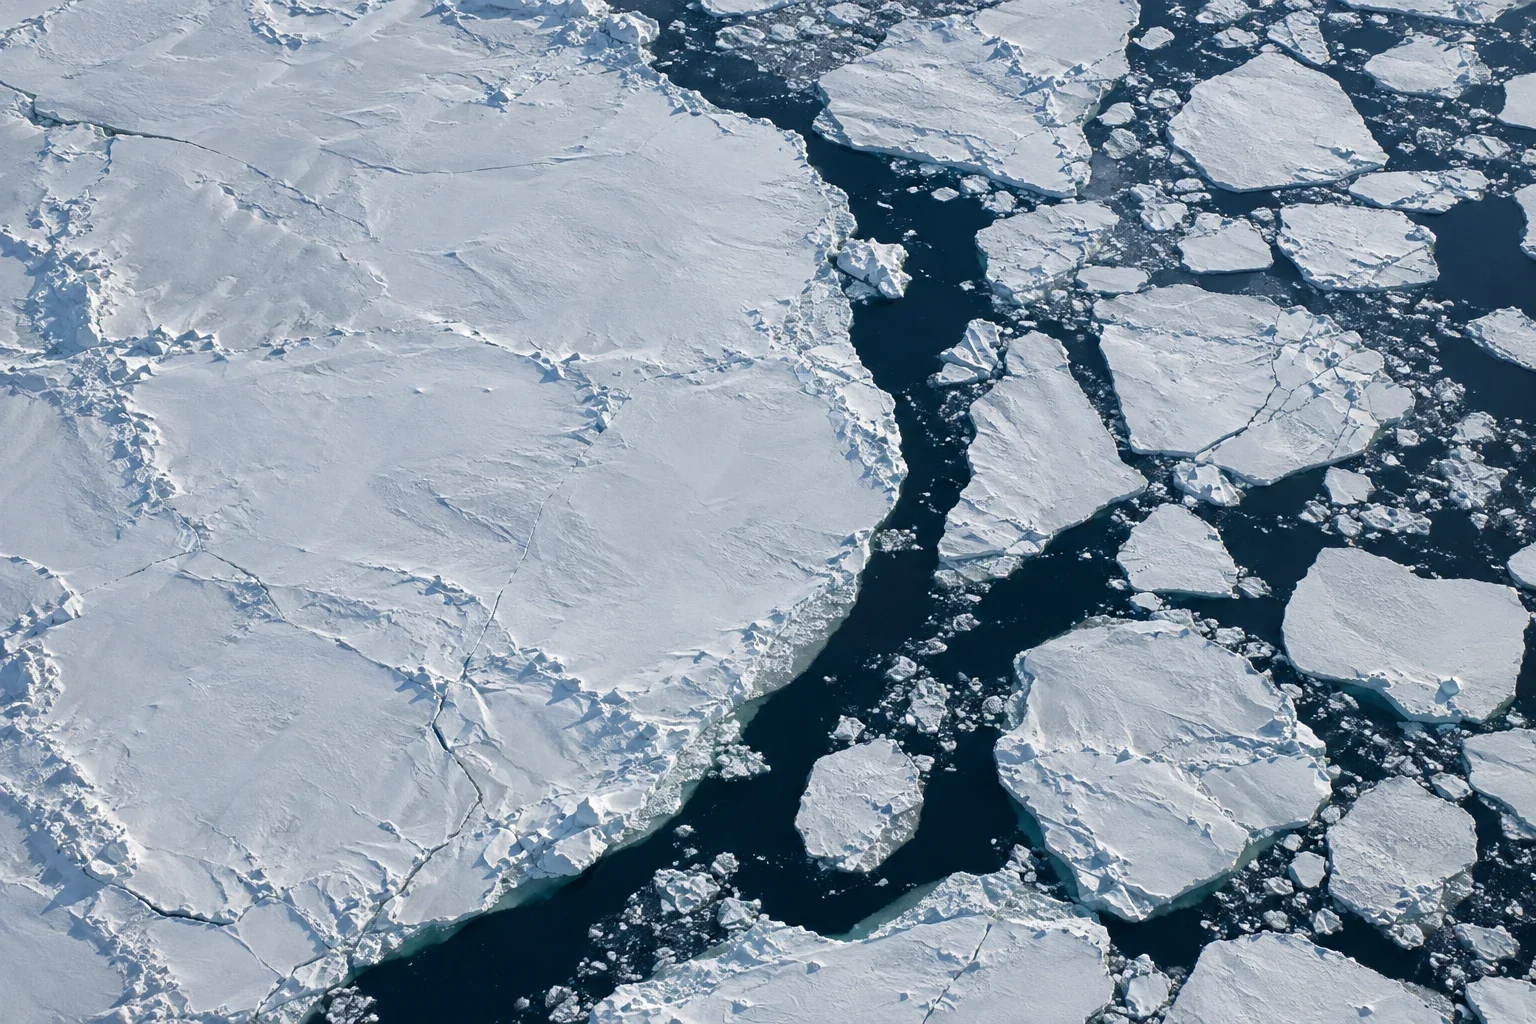
A sea-ice pixel is not a habitat map
Identical ice concentrations can conceal different floes, openings, and feeding opportunities. Habitat interpretation needs geometry, seabed context, compatible dates, and evidence of what animals actually use.
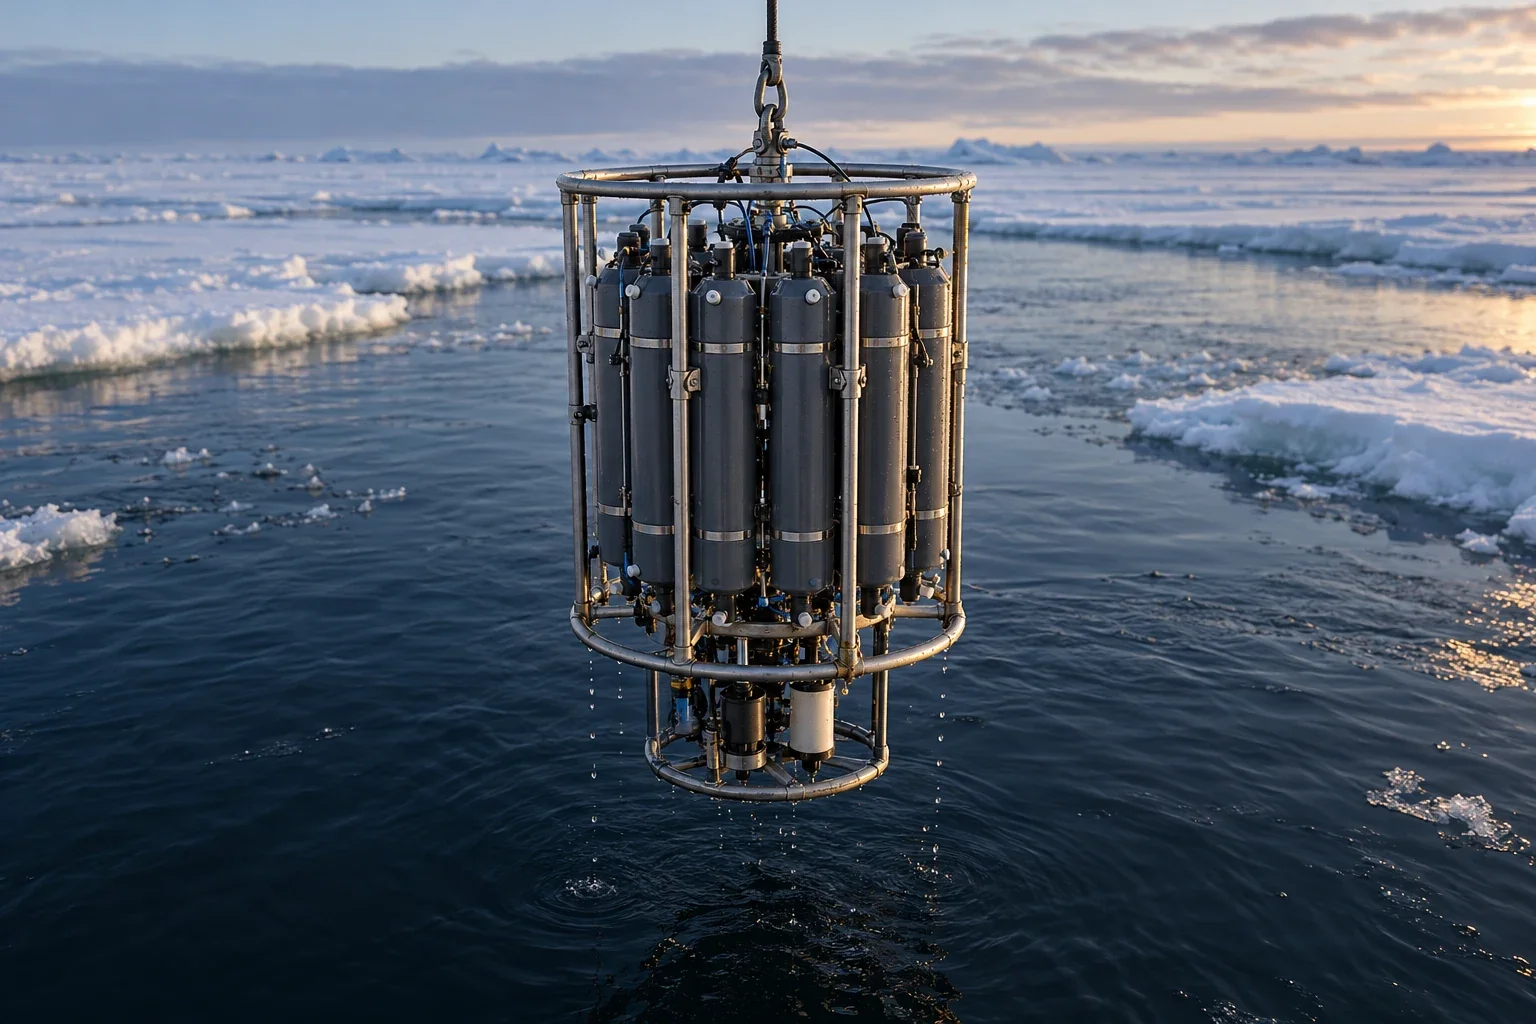
The warmth beneath the Arctic surface
Atlantic-origin warmth can sit below cold surface water. Density layers, currents, and mixing determine when stored ocean heat becomes heat delivered to sea ice.
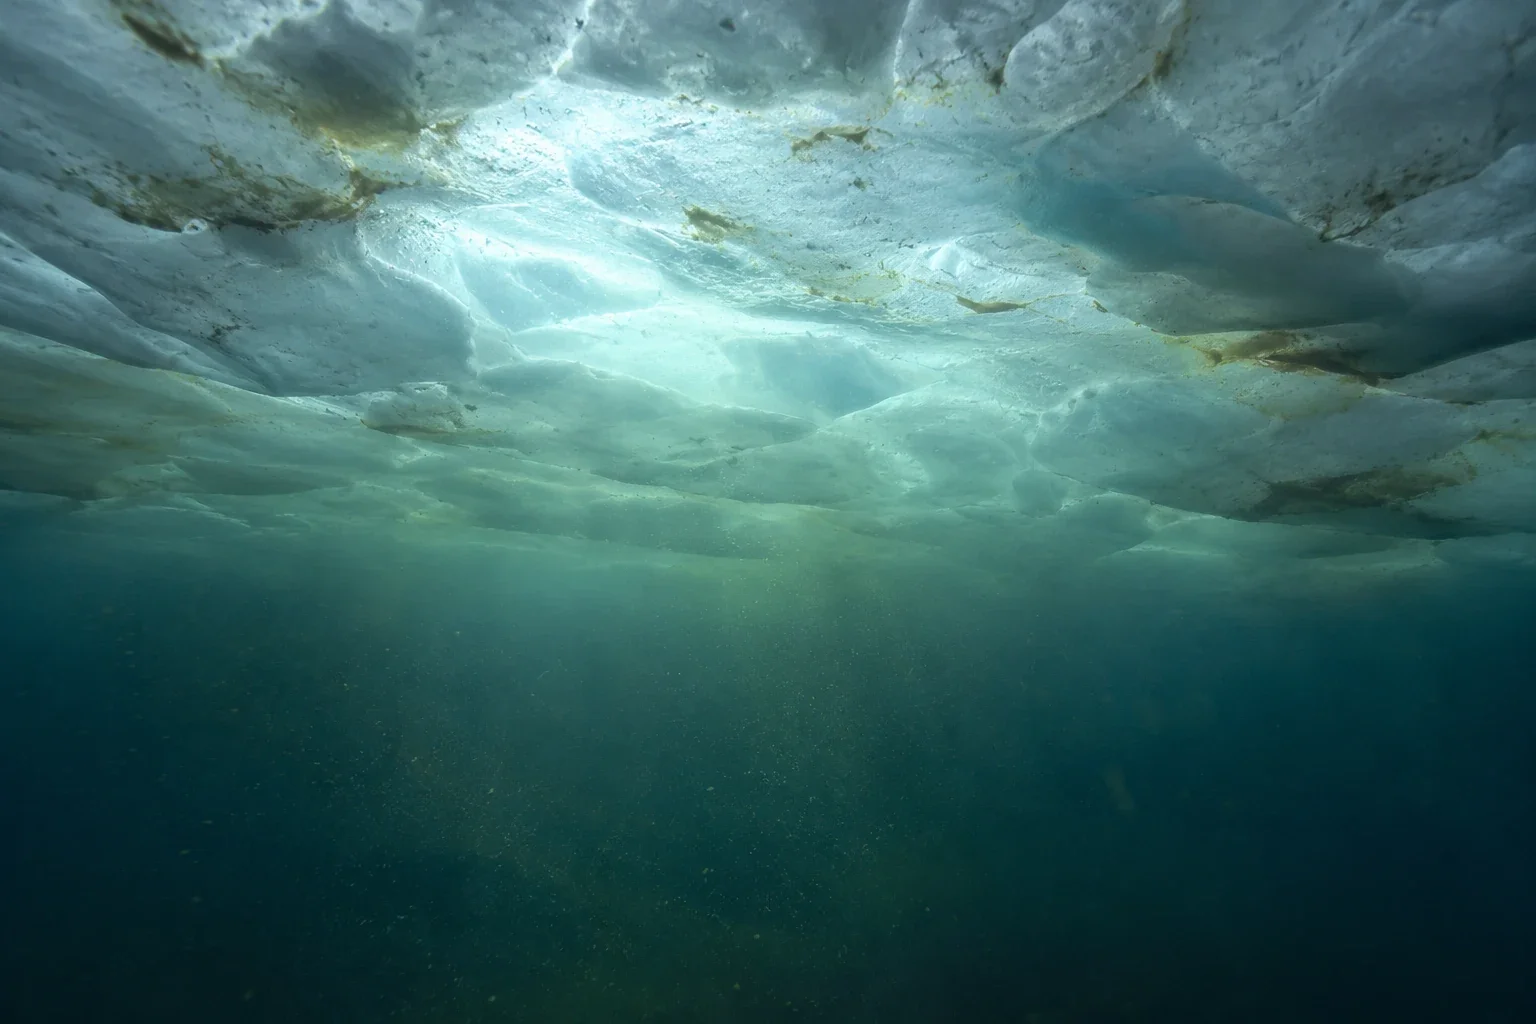
The bloom can begin before open water
Under-ice blooms complicate the seasonal calendar. Light transmission, nutrients, consumer timing, and satellite blind spots explain why open water is not the food web's starting gun.
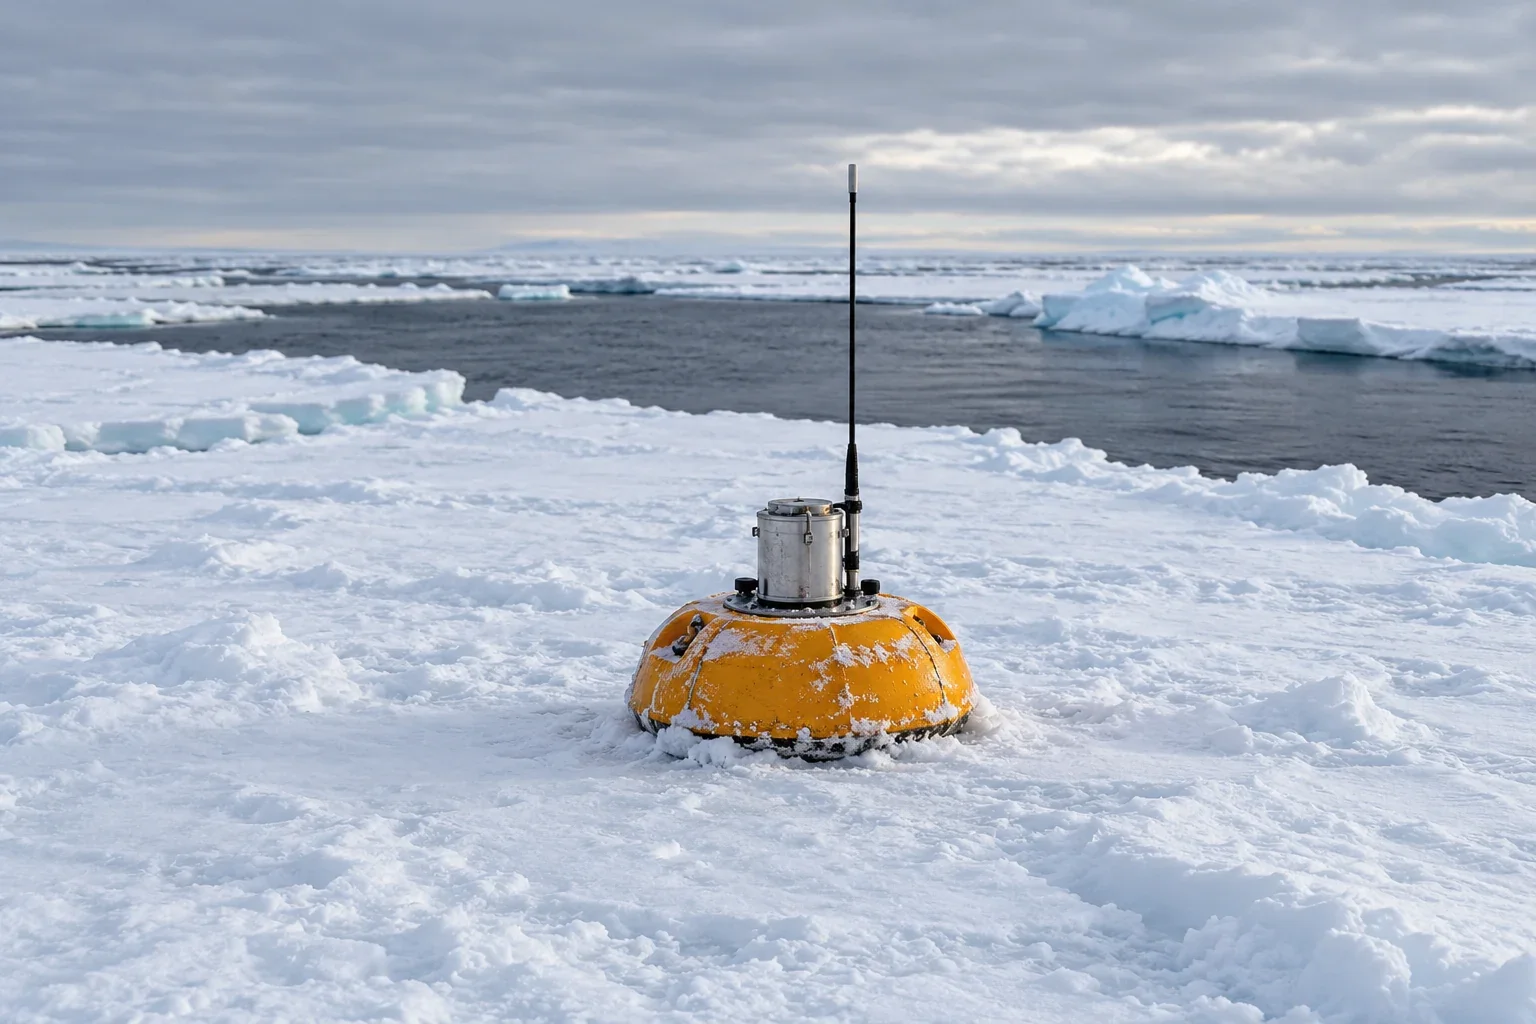
A drifting instrument is not a fixed station
A rising temperature line may record movement through a water-mass boundary. Following position, depth, and salinity helps distinguish spatial structure from change through time.
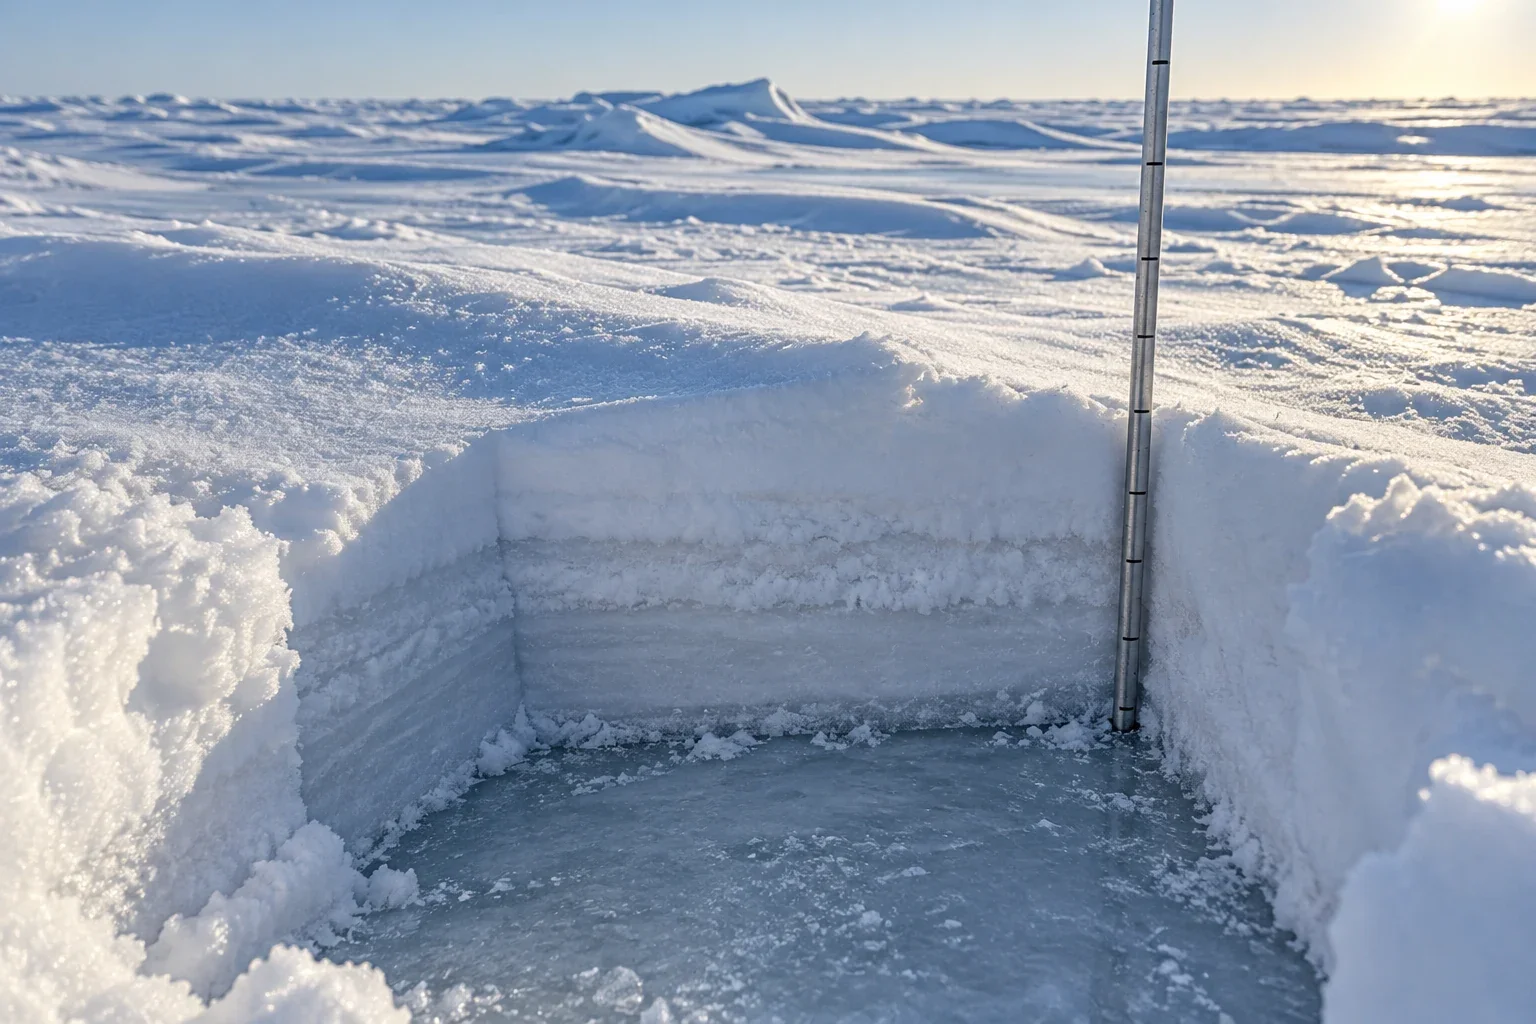
Snow on sea ice has two seasons
Why a snow blanket can slow winter ice growth yet delay spring melt, and why depth, density, timing, and wind redistribution belong in the comparison.
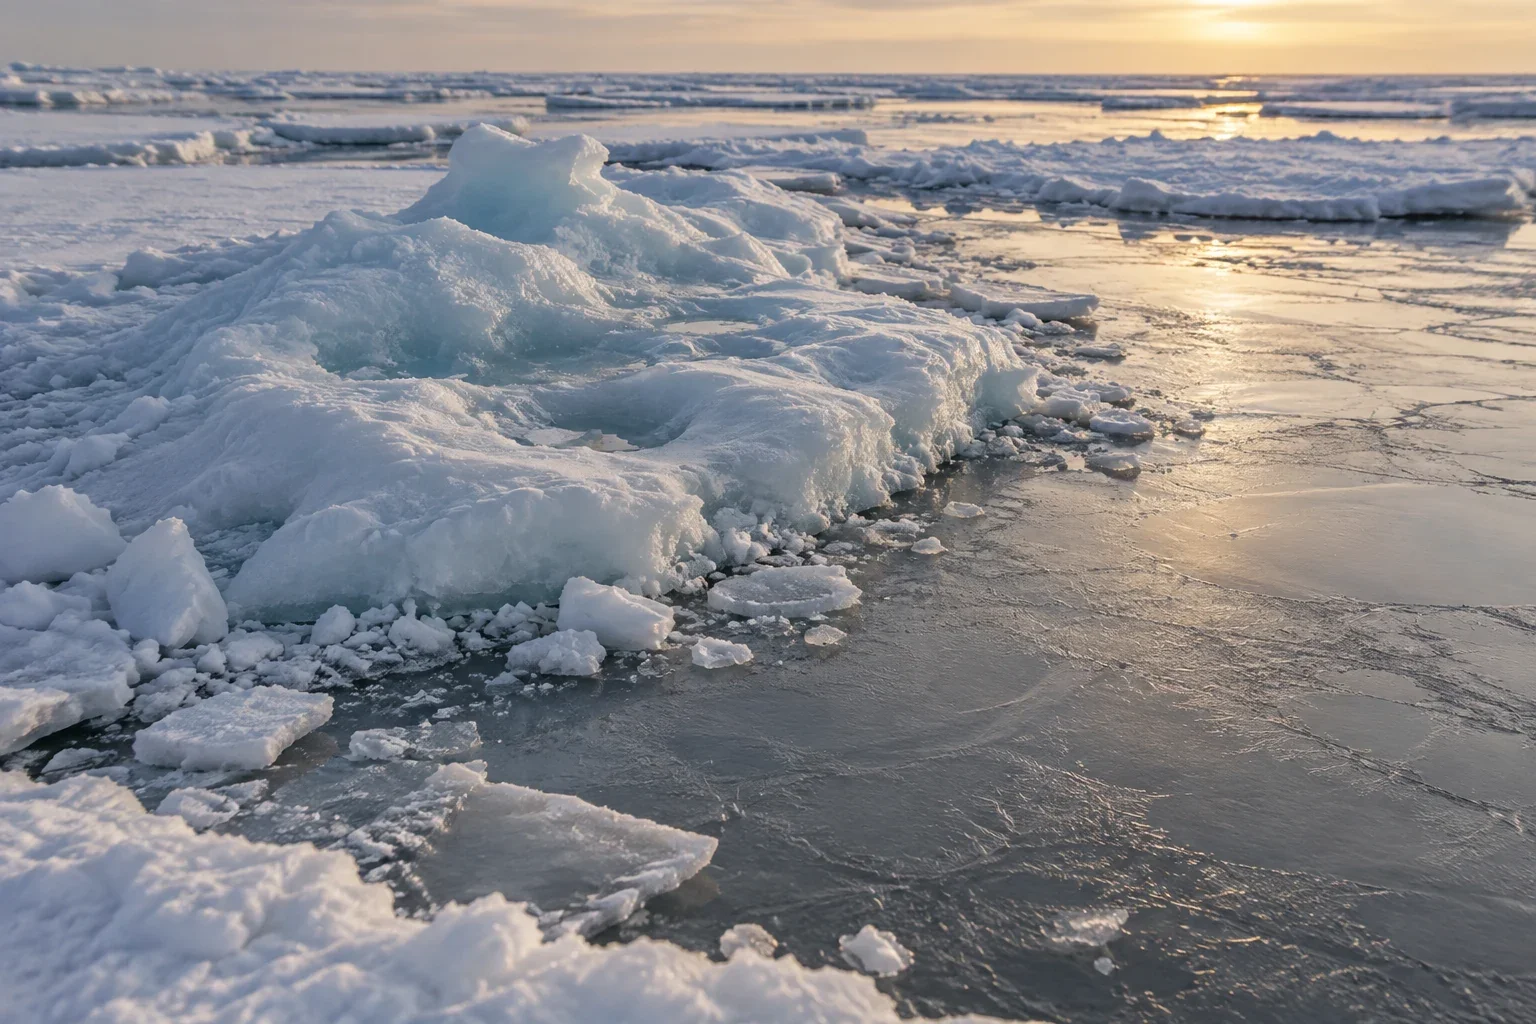
How old is that sea ice?
Ice-age colours track survival and movement, not every floe's thickness. Learn what the oldest category in a grid cell reveals, conceals, and cannot promise.
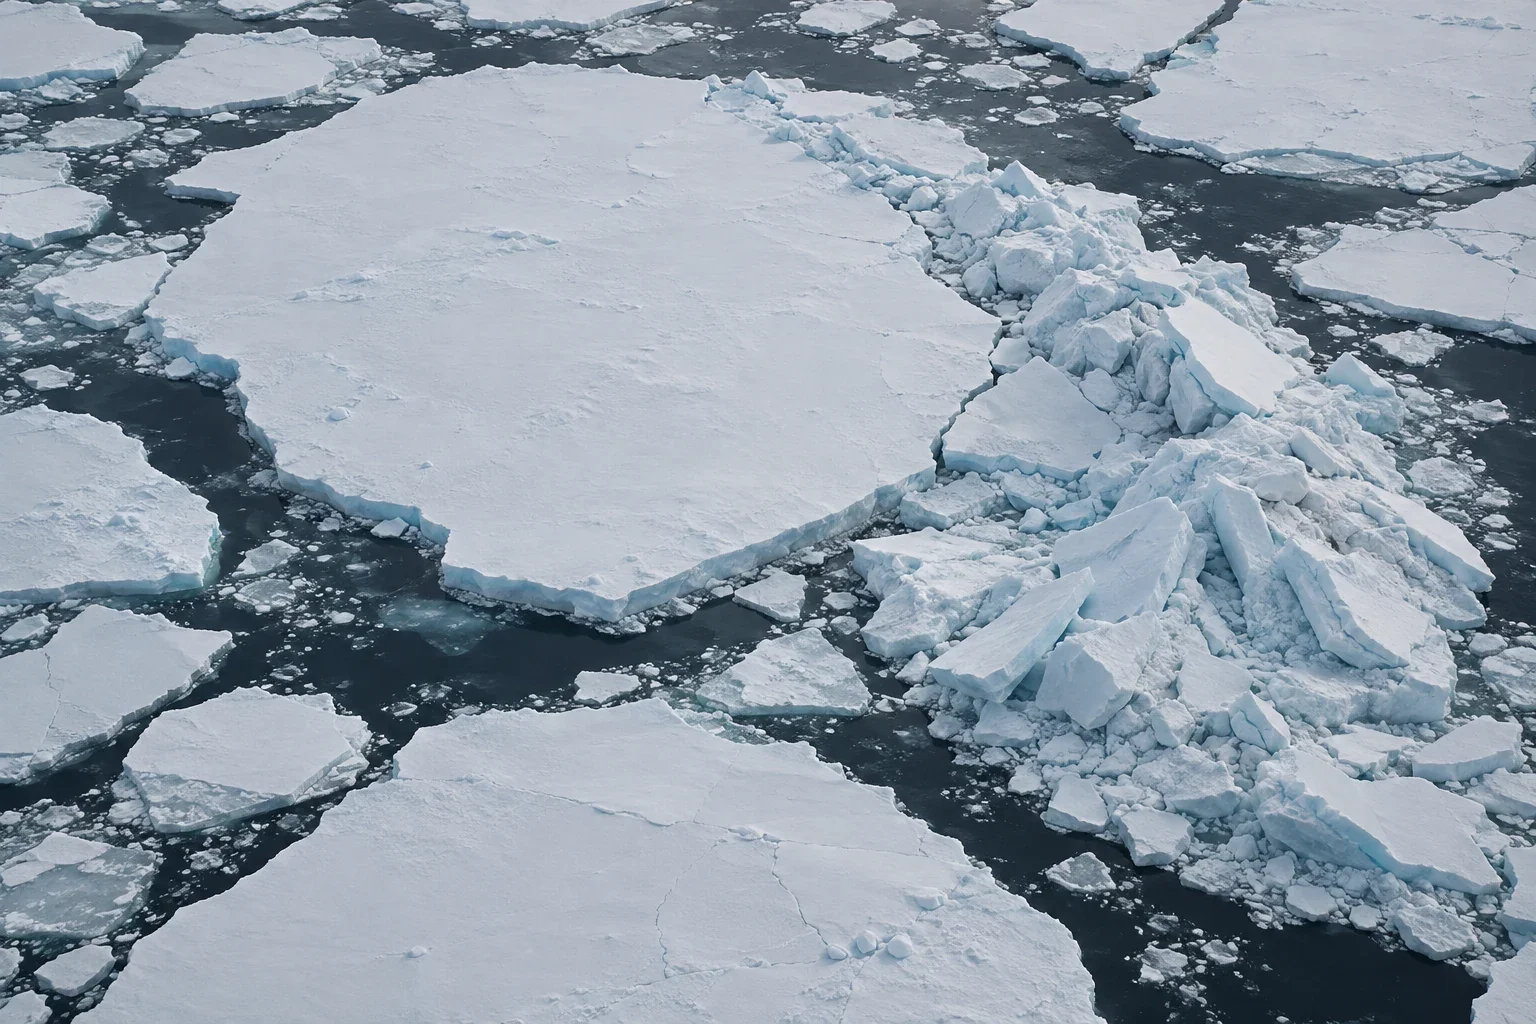
Extent and volume tell different ice stories
A worked example separates extent, area, and volume, then shows why wind, thickness estimates, seasonal timing, and model uncertainty can make ice graphs tell different stories.
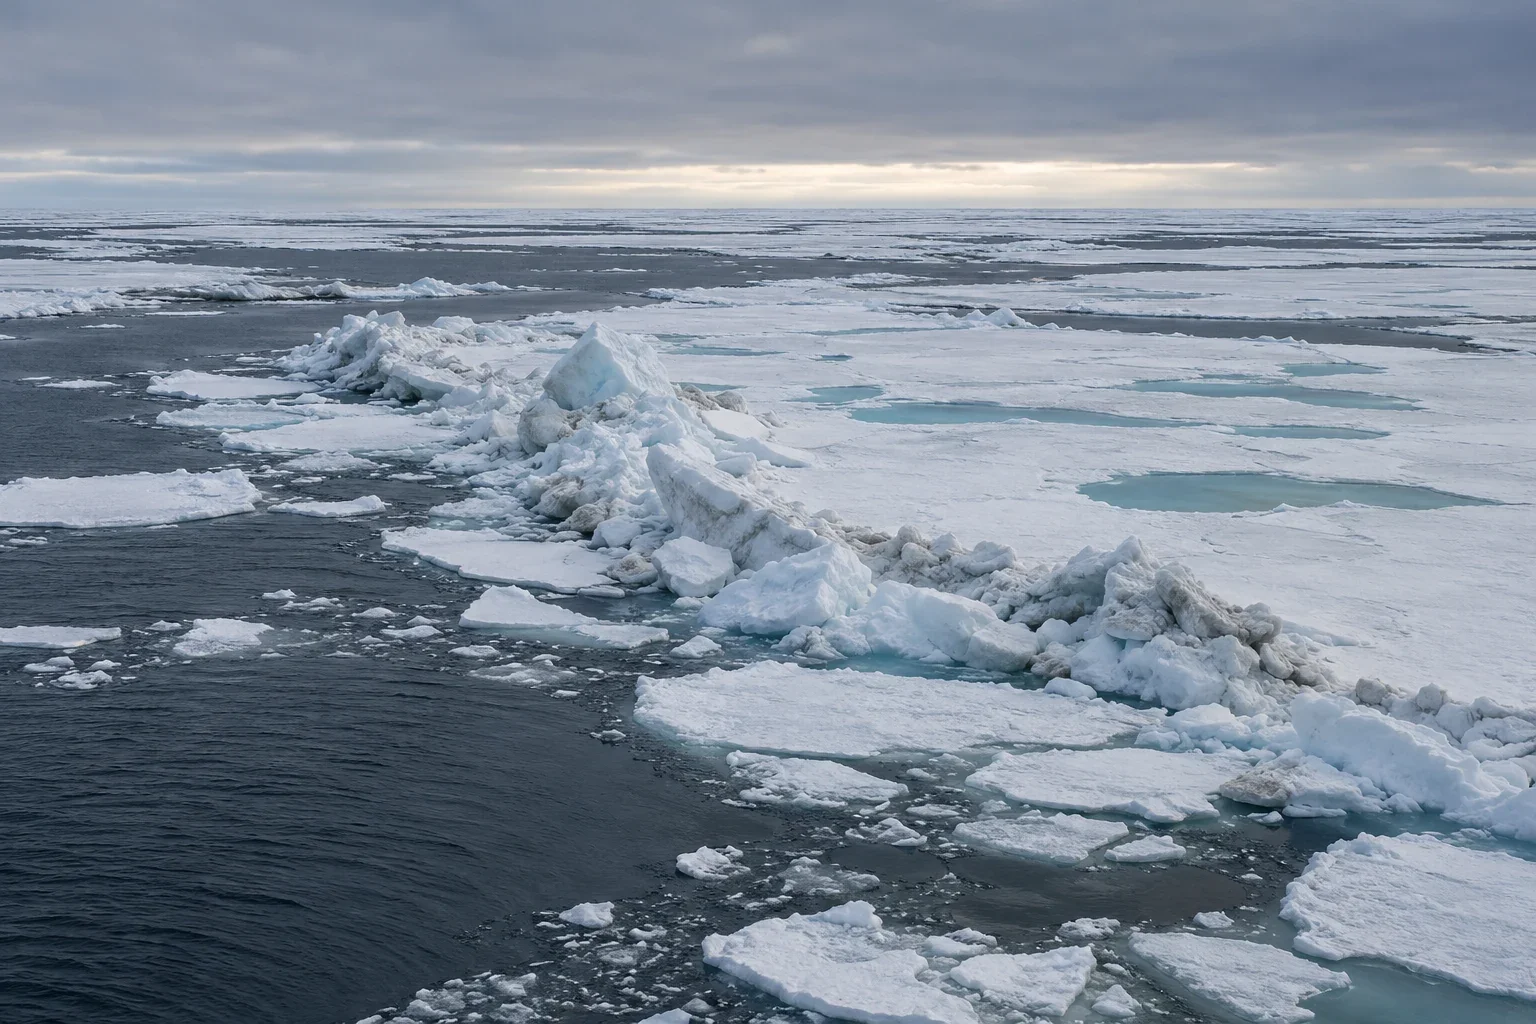
At the ice edge north of Svalbard
A careful reading of melt ponds, pressure ridges, kittiwakes, wildlife distance, and younger sea ice.