

Rare events and the denominator of a flag
High sensitivity does not establish that most threshold flags are correct. This educational methods note uses a synthetic waveform archive to distinguish sensitivity, false-positive rate, precision, false-alarm ratio, and overall accuracy. Natural-frequency tables demonstrate how a rare target can yield more incorrect than correct flags, while a second population shows how precision changes with the base rate even when conditional rates are held fixed. A stricter invented threshold makes the retrieval and review-burden trade-off explicit. Primary reasoning and classifier-evaluation studies accompany forecast-verification definitions. The note also addresses event units, correlated windows, threshold tuning, and human review. It validates no detector, recommends no operational threshold, and explicitly excludes medical, navigation, emergency, and other safety applications.
The missing peak: a worked missing-not-at-random example
An apparently complete environmental record can underestimate its target when high values are less likely to be retained. This methods note presents a wholly fictional 100-value index series whose response-dependent missingness lowers the observed mean. It compares zero replacement, complete-case averaging, mean imputation, interpolation, and model-based assumptions, then expresses the complete-period mean as a function of the unknown missing-value mean. A sensitivity table and an educational tipping point make the unidentifiable component explicit. Seaman and colleagues' missingness definitions, CF conventions, and observing-network context frame the analysis. No empirical correction, safety threshold, or acceptable completeness percentage is proposed. The note argues for preserving failure information and reporting assumption-dependent conclusions rather than allowing a smooth completed series to conceal selection.
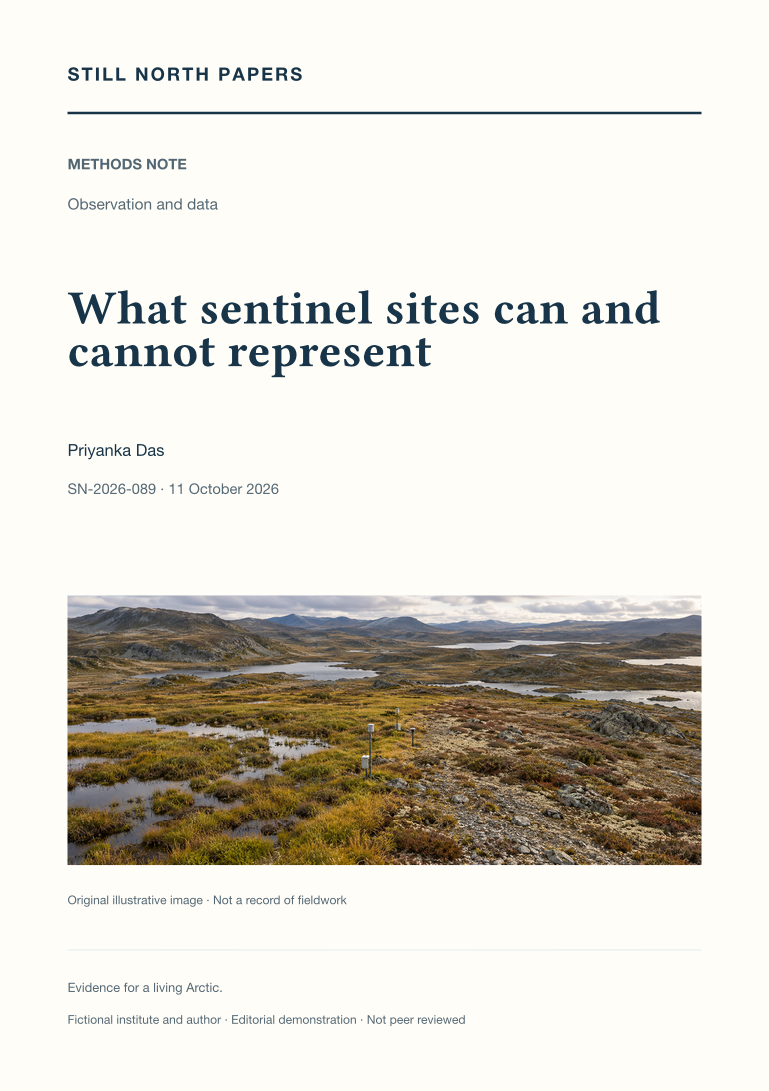
What sentinel sites can and cannot represent
Sites selected for sensitivity or continuity can provide excellent process evidence without representing a region. This methods note combines primary preferential-sampling research, EPA probability-survey guidance, and climate-observing sources to examine that distinction. A fictional catchment census shows how a sentinel network concentrated in sensitive terrain can yield a site fraction far above the regional proportion. The analysis separates population targets, weighting, purposeful selection, probability sampling, and conditional model-based expansion. It considers hybrid networks, transfer-oriented evaluation, changing representativeness, and protected selection records. No actual regional condition or optimal site list is estimated. The implication is to retain detailed sentinel findings and separately justified regional estimates as complementary products, rather than treating repeated measurements at informative sites as a cure for missing population coverage.
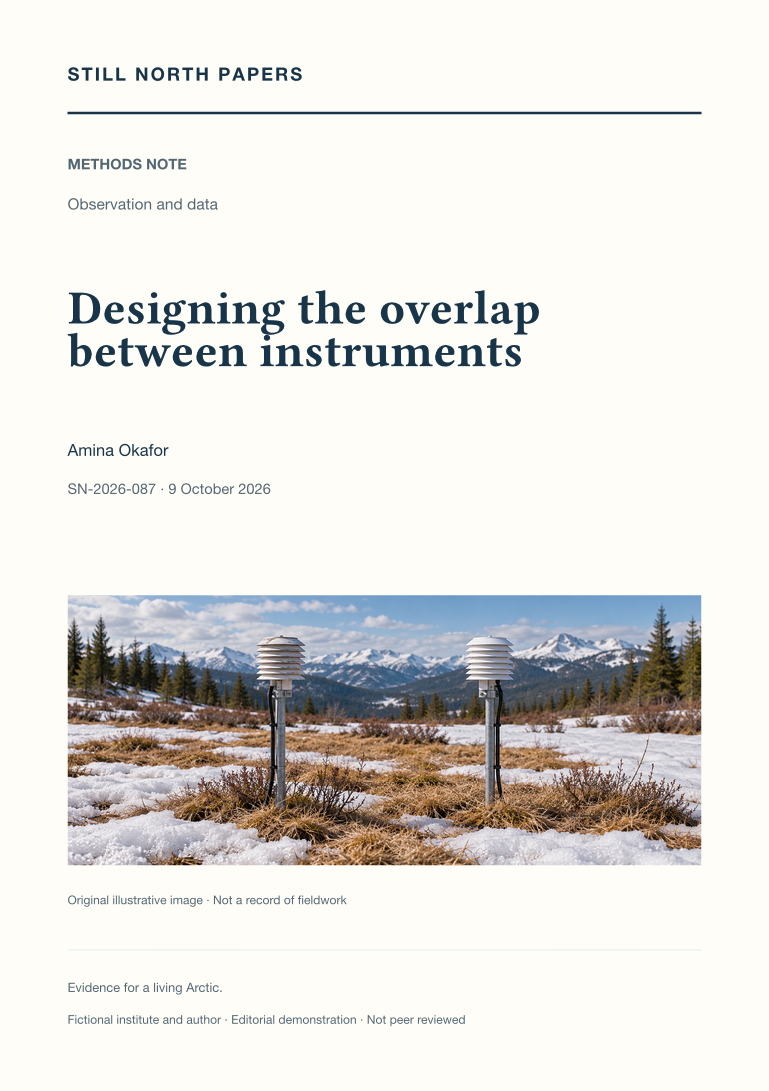
Designing the overlap between instruments
Replacing an instrument can improve measurement while disrupting a long record. This methods note synthesises GCOS change-management principles, NIST traceability policy, the JCGM uncertainty guide, and Arctic observing-network context to examine what an overlap period must establish. A fictional temperature comparison demonstrates how a small mean offset can conceal a scale-dependent difference. The analysis treats condition coverage, measurand equivalence, time alignment, correlated pairs, uncertainty in both instruments, and reversible corrections as distinct design questions. It separates calibration, numerical continuity, and validation, and explains the additional limits when simultaneous comparison was impossible. No universal overlap duration, sample count, or calibration procedure is proposed. The aim is a bounded statement of comparability supported by preserved evidence before retirement makes that evidence unobtainable.
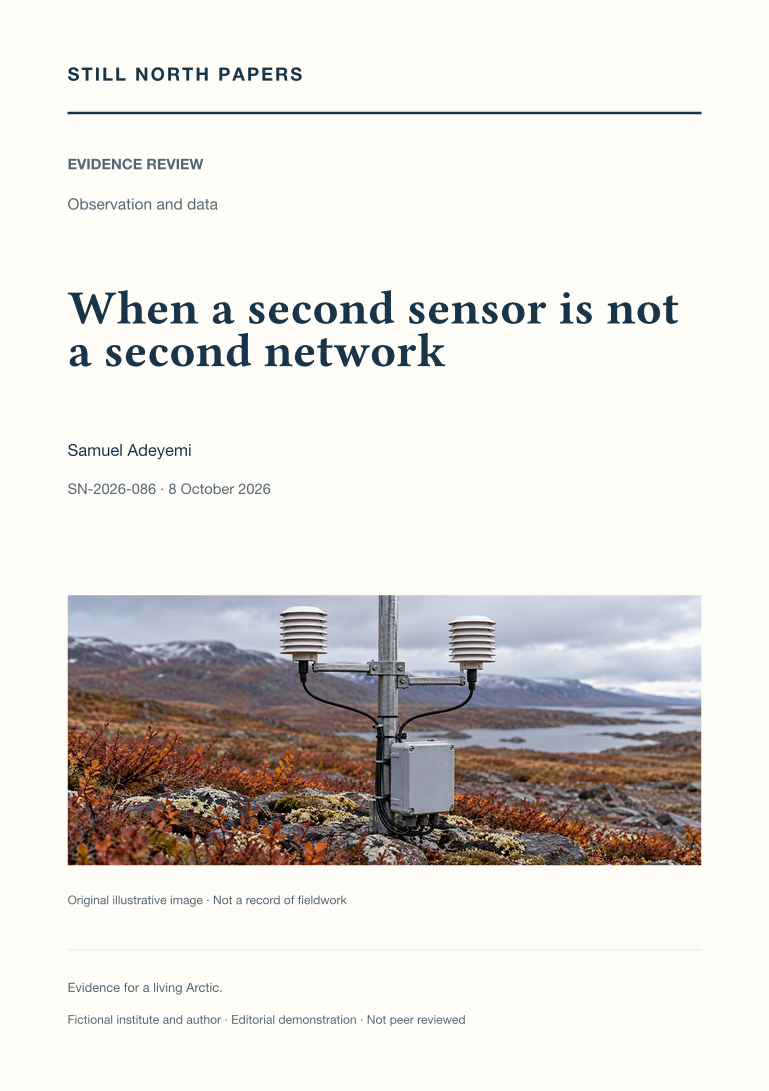
When a second sensor is not a second network
Instrument counts alone do not establish observing-network resilience. This evidence review combines the Arctic observing-network assessment, GCOS monitoring principles, and measurement-uncertainty guidance to distinguish redundancy for availability, accuracy, coverage, and timely delivery. A fictional reliability calculation contrasts independent failures with two instruments sharing a vulnerable platform. Further analysis follows common dependencies through calibration, software, archives, funding, and specialist expertise, while distinguishing environmental correlation from correlated measurement error. The review considers removal experiments and irreversible gaps in long records without ranking actual investments or specifying operational safety coverage. It also rejects treating community-led observation as an interchangeable spare component. Redundancy is most defensible when it protects a named evidential function through an independent, authorised route whose limitations are documented.

A rank is a distribution
Sorting point estimates creates an order even when observations cannot reliably resolve the differences. This methods note distinguishes descriptive ranks from uncertainty in rank, drawing on league-table methodology, the JCGM uncertainty framework, and NASA's GISTEMP ensemble documentation. A fictional two-estimate comparison holds marginal uncertainties fixed while changing error correlation, showing why individual uncertainty bars cannot determine support for a lead. The note then explains joint propagation through ranking, finite-ensemble limits, comparison-set definitions, and public displays that retain magnitude alongside position. It calculates no actual climate ranking and does not extend NASA's documented ensemble beyond its stated period. The principal implication is to report an estimated order separately from its model-dependent stability, especially when ordinal cutoffs carry decision consequences.

Cite the release, not the latest link
A persistent dataset address can resolve successfully while no longer providing the evidence used in a published calculation. This methods note compares FORCE11 citation principles, DataCite versioning guidance, and Research Data Alliance recommendations for evolving data. A fictional index revision separates corrected observations from expanded coverage and demonstrates why collection identifiers, release identifiers, subsets, and analysis outputs answer different questions. The discussion examines immutable releases, timestamped queries, stable sorting, checksums, and persistent landing pages without presenting any one repository design as mandatory. It distinguishes exact reproduction from scientific robustness and explains why reproducibility does not override legitimate restrictions. The resulting recommendation is a compact citation backed by recoverable authorised evidence and an inspectable method, with explicit limits when retrieval becomes impossible.
An evidence session with room for a better question
An effective school or community evidence session can concentrate on one answerable Arctic question rather than an exhaustive presentation. This essay proposes a session around the difference between a record-low winter sea-ice maximum and a summer minimum, using NOAA's resource kit and sea-ice chapter. Participants inspect an accessible figure, identify observations, check definitions, and test a claim before writing a supported finding, a limit, and a next question. Daily and monthly statistics provide a second opportunity to practise reading captions and tables. The discussion separates factual corrections from value disagreements and uses the National Inuit Strategy on Research to respect attributed authority without asking individuals to represent a people. Its intended outcome is traceable reasoning and continued questions, not pledges, recall, or manufactured agreement.
Read the Arctic Report Card beyond the headlines
Annual Arctic headlines describe different quantities rather than a single environmental score. This essay follows claims through NOAA's 2025 Report Card chapters to show how definitions, units, periods, baselines, and record lengths constrain interpretation. Sea-ice extent is distinguished from thickness and age, while daily minima and monthly averages illustrate how a correct value can be paired with an incorrect ranking. Different calendars underlie the temperature and Greenland annual assessments. Apparent contrasts, including a record-low winter maximum without a record-low summer minimum, invite explanation rather than selective quotation. The observing-network chapter also has a bounded assessment population, not universal coverage. A concise reading note preserves each finding with its place, period, method, important limit, and chapter before the headline is shared.
Say what is uncertain, precisely
Useful uncertainty communication identifies what is uncertain and what that changes. This essay separates observed quantities, their uncertainty, explanations, and policy decisions rather than allowing a vague caveat to weaken every statement. IPCC guidance supplies the distinction between confidence based on evidence and agreement and likelihood expressed as quantified uncertainty. NOAA's Greenland assessment illustrates the need to preserve measurement periods and context when comparing annual and partial-year estimates, and to distinguish reduced loss from recovery. The discussion also explains why shaded bands and plus-or-minus notation require definitions. Bounded claims about sampled places, seasons, or detections are more informative than blanket reassurance or dismissal. A decision still requires explicit consideration of consequences, affected people, and review triggers; an uncertainty interval cannot choose the policy.
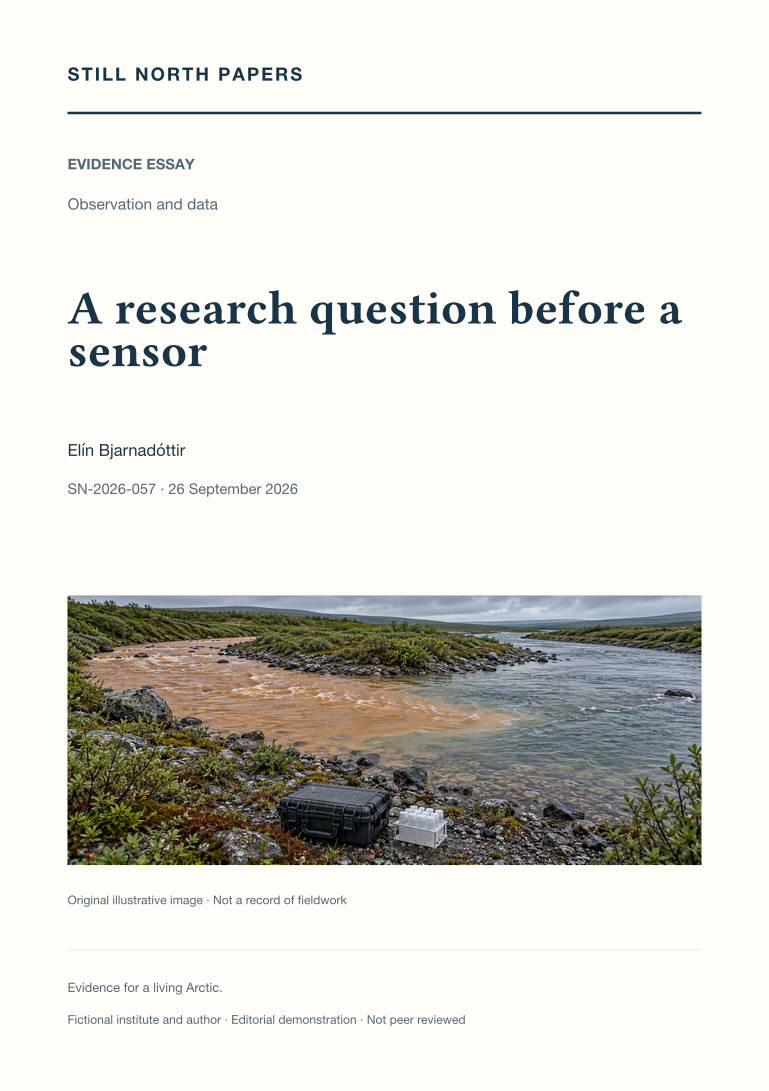
A research question before a sensor
Choosing a sensor before defining the research question can produce precise data that do not answer the original concern. This essay works backwards from a hypothetical river-colour problem to distinguish community concern, a researchable comparison, and the decision a limited study might inform. It examines competing explanations, representative locations, event timing, existing records, and plans for unsafe access or missing samples. The National Inuit Strategy on Research supplies governance context, and NOAA's network assessment illustrates why more observations at an unsuitable location do not repair every gap. Equipment selection follows the required quantity, discrimination, and coverage, with maintenance and stewardship included. Rehearsing a possible result using explicitly invented values tests whether the proposed observations could distinguish explanations without predetermining the finding.
A reproducible chart starts before the chart
A chart's source link does not preserve the decisions that produced its values. This essay explains how a reproducible public graphic begins with a defined question, comparable quantities, and an explicit analysis record. NOAA's Arctic temperature chapter illustrates the importance of geographical coverage, water-year timing, baselines, and distinct input products. A simplified baseline example separates a changed reference from a changed observation, while noting that other processing choices can also differ. The proposed compact recipe retains input versions, retrieval dates, selections, weighting, filters, completeness rules, and transformation order. Climate and Forecast history conventions support this record but do not replace explanation. Accessible tables, labelled uncertainty, and distinctions between measurements and estimates help readers recover the calculation even when they disagree with its interpretation.
Maintenance is the next observation
A durable observation record depends on funded maintenance, skilled people, and governed stewardship as much as on an initial sensor purchase. This essay uses a fictional station budget to identify omitted costs such as calibration, communications, processing, handover, and removal. NOAA's network assessment provides evidence for the wider importance of expertise, infrastructure, and product continuity, without serving as a live account of programme finances. Missing seasons and lost instrument overlap cannot simply be restored by buying replacement hardware. The National Inuit Strategy on Research also informs attention to priorities, capacity, and budget authority. The discussion recommends comparing contributions and dependencies openly, including responsible closure where justified. Support should sustain usable evidence, not purchase predetermined conclusions, exclusive knowledge, or unsupported claims of deployment success.
The calibration record behind a trusted number
A calibration certificate characterises response under stated conditions, not the fitness of every later field value. This essay draws on NIST's traceability policy to distinguish documented reference chains from reassuring equipment labels, and calibration from adjustment. Hypothetical deployment examples show how exposure, depth, and installation can undermine representativeness even when a sensor responds correctly. Field checks, post-deployment changes, and shared biases require explicit limits rather than assumed histories of gradual drift. NOAA's observing-network assessment supplies context for transitions between instruments and the value of comparable overlap. The practical recommendation is to preserve raw values, reference details, conditions, uncertainty contributions, correction parameters, and method versions. A trusted number is one whose measurement and correction history a future researcher can reconstruct for its intended use.
Missing observations are not zeroes
A missing observation, a usable recording with no detections, and a signal obscured by noise support different conclusions. This essay uses hypothetical acoustic records to distinguish counts from effort-adjusted rates and to show why downtime must not become successful listening. It draws on Climate and Forecast conventions to discuss missing-value codes and separate quality flags, including the care needed for values below reporting limits. NOAA's observing-network assessment supplies context for uneven seasonal and spatial coverage. When gaps depend on weather or access, the remaining record may not represent the full conditions of interest. The practical recommendation is to preserve reasons for absence, coverage rules, method changes, and visible chart gaps, while distinguishing estimated values from measurements and never treating zero detections as proof of animal absence.
Metadata that outlives an instrument
Measurements can survive while the context needed to interpret them disappears. This essay identifies metadata that preserves comparability, reproducibility, and permission to use a record. A fictional temperature-logger replacement illustrates how altered sampling intervals can change an analysis unless deployment and aggregation choices remain explicit. Climate and Forecast conventions provide an existing language for quantities, coordinates, units, and history, complemented by separate deployment and processing logs. NOAA's observing-network assessment supplies wider context for sensor transitions and recalibration. The discussion recommends retaining original observations, versioned products, documented corrections, access conditions, and an institutional stewardship role. Complete documentation is not equated with unrestricted publication. A practical handover exercise asks whether an unfamiliar reader can explain one published value using the archive alone, without relying on someone's memory.
A quiet recording is not an empty sea
Acoustic non-detections are traced through the links between animal presence, sound production, propagation, recorder performance, and classification. The essay uses a hypothetical comparison of continuous and intermittent recording to show why deployed days or simple hourly adjustments can misrepresent listening effort when calls occur in bouts. Changing background noise, sensitivity, and detector thresholds can also change detections without a matching change in abundance. Drawing on NOAA's acoustics guidance and data portal, it argues for representative manual review, uncertain classifications, and explicit separation of lost, rejected, unrecorded, and analysed intervals. Visual observations can add evidence but retain their own limits. The defensible conclusion concerns calls detected under a stated method; claims about absence or density require stronger detection assumptions and knowledge of call rates.
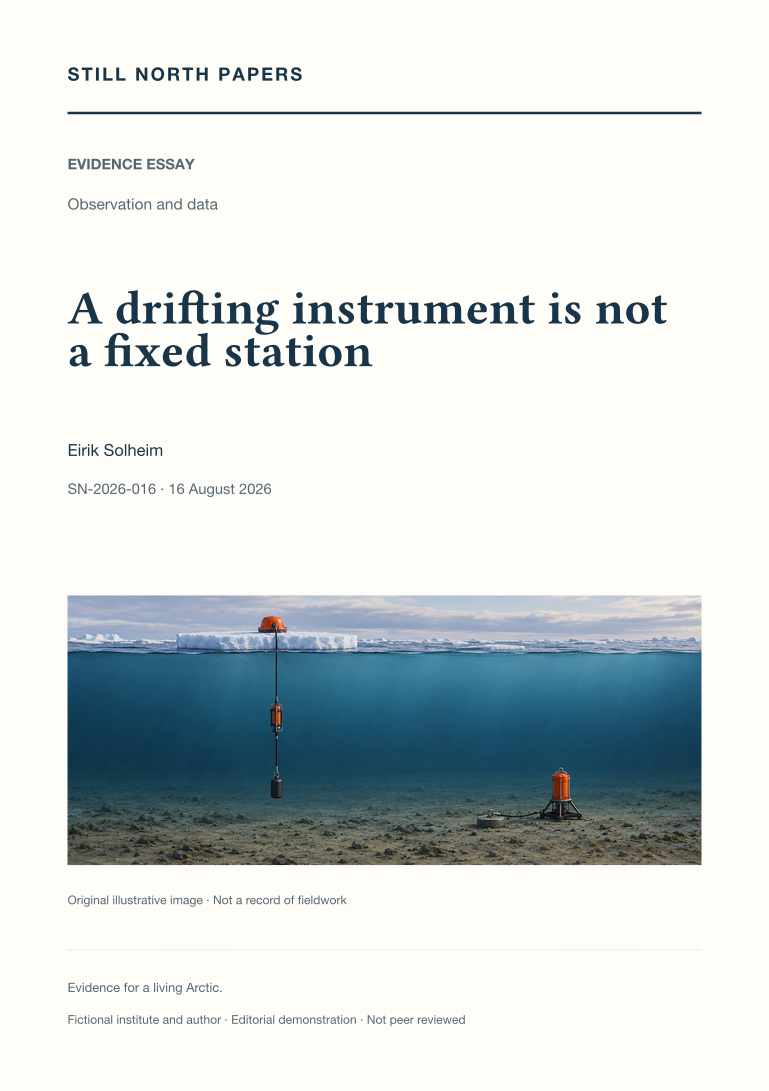
A drifting instrument is not a fixed station
A rising temperature series from a drifting instrument can record a journey across ocean structure rather than local warming. This essay contrasts ice-tethered profilers with anchored instruments and uses an explicitly invented water-mass crossing to separate spatial variation from change through time. It also explains why a fixed mooring can record a displaced current or layer, so anchoring does not remove every interpretive ambiguity. Position, pressure, temperature, salinity, currents, and repeated profiles constrain different alternatives. Maps and depth-distance sections can reveal coverage changes hidden by monthly means, while many neighbouring profiles do not become independent basin-wide samples. Published Arctic ocean assessments provide context for combining viewpoints. The practical implication is to retain platform movement and instrument geometry as explanatory evidence, not remove them from the story.
Measuring a glacier in footsteps
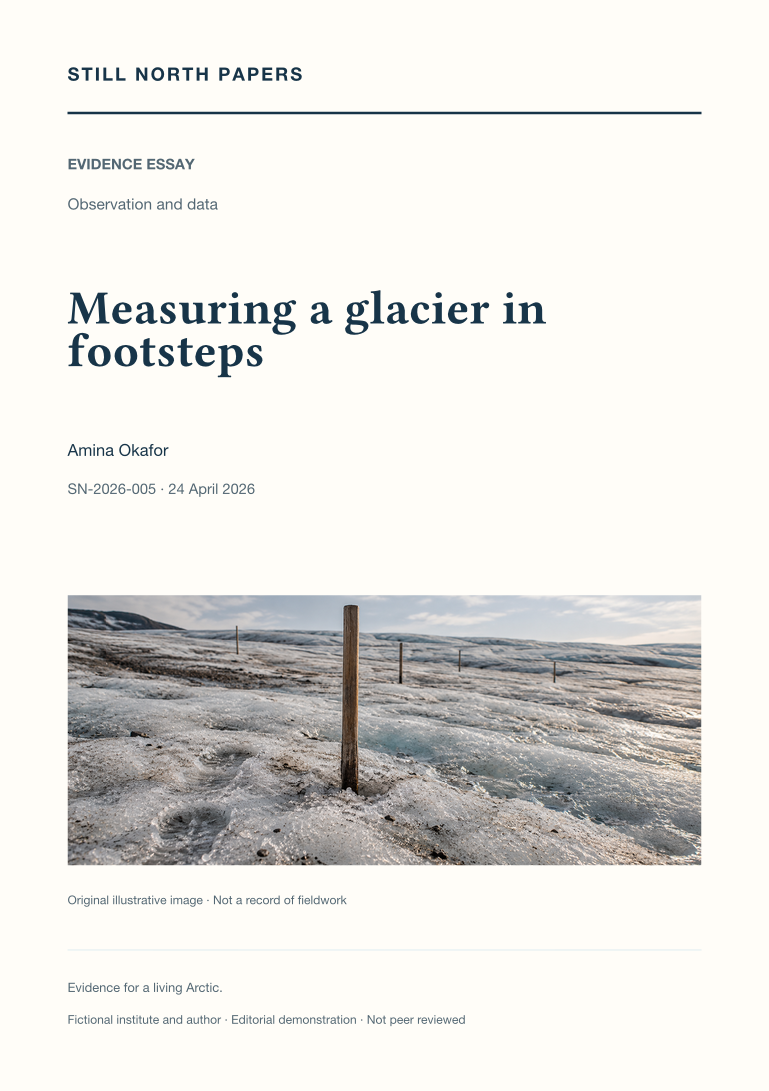
Ablation stakes provide the focus for an illustrative explanation of repeated glacier measurement and its limits. The essay follows stake placement, installation, exposed-length readings, surface conditions, density assumptions, and the records needed when a marker moves, tilts, disappears, or is replaced. A point measurement can describe local surface change, but neither a convenient transect nor a visible row of stakes establishes the mass balance of Greenland. Published regional estimates are therefore placed alongside, rather than attributed to, the field scene, with their uncertainty retained. The account explains how stake networks complement weather observations, satellites, models, and discharge measurements. Its practical conclusion is that continuity depends on explicit reference conventions, representative coverage, raw readings, and honest treatment of interruptions rather than an artificially seamless series.