

A midnight-sun tundra plot
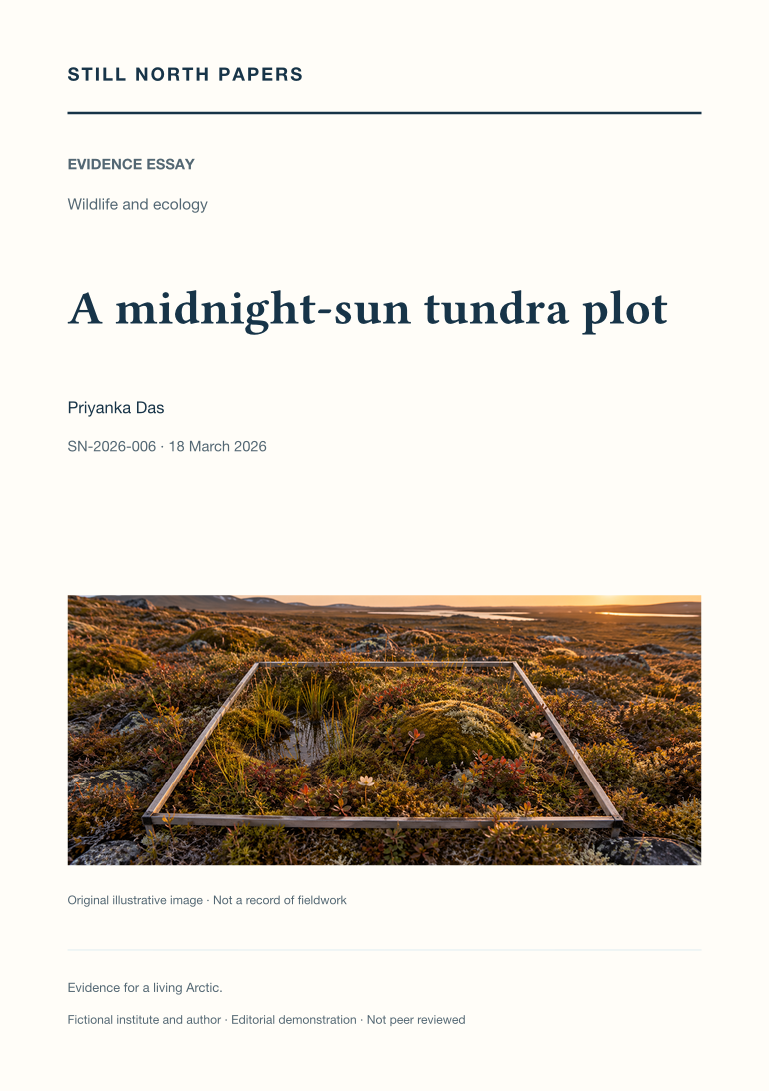
An illustrative tundra monitoring day links the detail inside a small sampling frame with the broader view of satellite greenness. The essay explains how fixed photographs, observer training, access routes, species records, moisture, and disturbance affect comparisons through time. It places the published regional greenness assessment in context without treating a greener signal as proof of ecological improvement or attributing it to fictional plot observations. Plant development, insects, and migratory birds introduce the additional records required to test seasonal mismatch, while timed watches show why a non-detection depends on effort and conditions. The account argues for retaining microtopography, local variation, missing observations, and method changes. Careful repetition and complementary scales, not a tidy image or regional average alone, support ecological interpretation.