

Comparing passive-microwave ice algorithms without a false winner
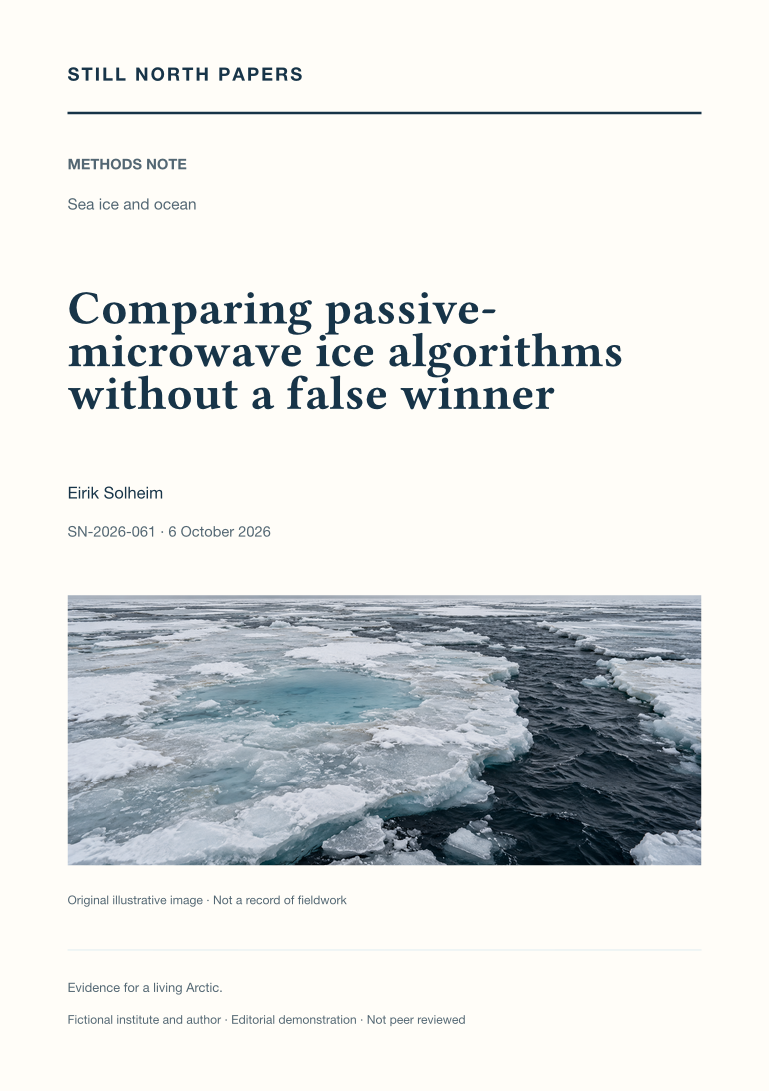
Passive-microwave sea-ice products can disagree because their retrievals, calibration, filtering, and surface assumptions differ. This methods note synthesises three published intercomparisons to show how a fair quantitative evaluation separates bias, scatter, spatial cancellation, and threshold effects. Invented matched-footprint examples demonstrate why zero average error can coexist with local errors, why clipping at full concentration can conceal retrieval bias, and why a small concentration difference can produce a large extent difference. The analysis distinguishes concentration from net ice surface fraction and treats summer melt as a separate evaluation problem. It does not rank current operational releases or rerun the cited studies. Its practical outcome is a conditional product comparison tied to a stated quantity, season, reference dataset, and downstream decision.
What an ice chart cannot promise
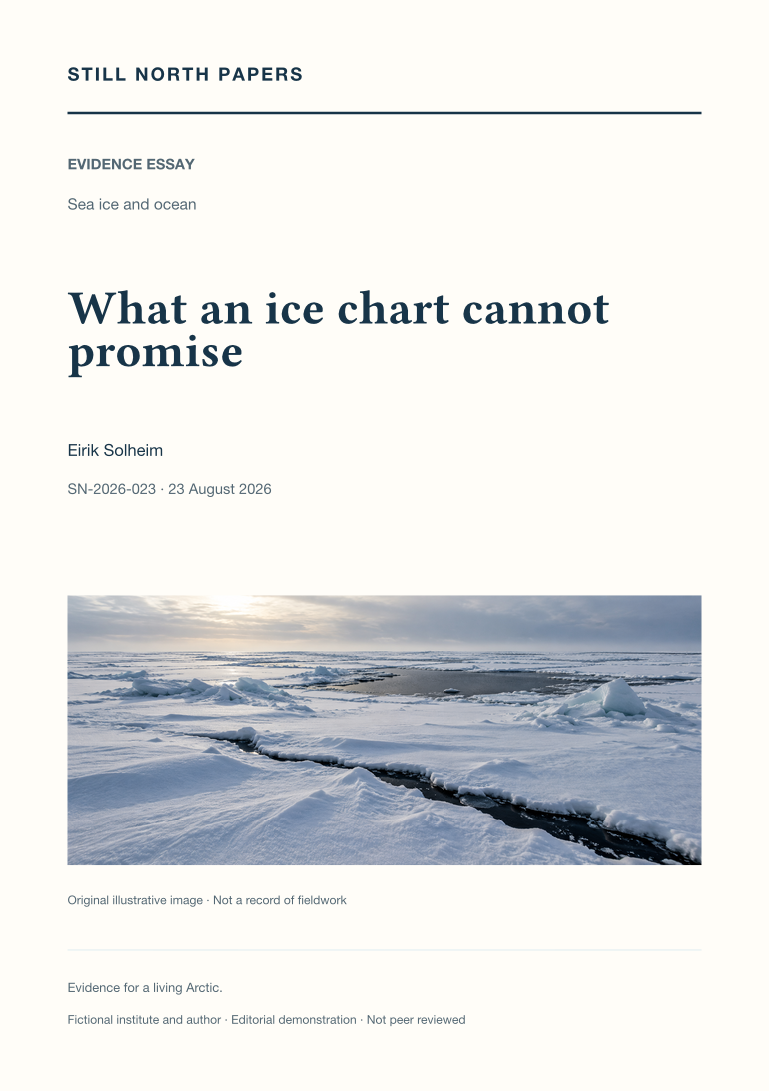
Regional ice charts are read as time-referenced analyses, not guarantees of connectivity, strength, or safe travel. The essay uses Canadian Ice Service documentation to distinguish observation, publication, and valid times, and to explain concentration, stage-of-development, and floe-form information in the egg code. An invented mixture demonstrates why partial concentrations describe an area rather than a sequence along a route. Drift, deformation, unresolved fractures, and separate iceberg information expose the limits of promoting one chart into a complete hazard map. Climate anomalies are also distinguished from operational permissions. No route or thickness recommendation is offered. The useful outcome is a complete product retained with its legend, source, time, and coverage, alongside recognition of the local competence, authority, and current information a journey would additionally require.