

An evidence session with room for a better question
An effective school or community evidence session can concentrate on one answerable Arctic question rather than an exhaustive presentation. This essay proposes a session around the difference between a record-low winter sea-ice maximum and a summer minimum, using NOAA's resource kit and sea-ice chapter. Participants inspect an accessible figure, identify observations, check definitions, and test a claim before writing a supported finding, a limit, and a next question. Daily and monthly statistics provide a second opportunity to practise reading captions and tables. The discussion separates factual corrections from value disagreements and uses the National Inuit Strategy on Research to respect attributed authority without asking individuals to represent a people. Its intended outcome is traceable reasoning and continued questions, not pledges, recall, or manufactured agreement.
Read the Arctic Report Card beyond the headlines
Annual Arctic headlines describe different quantities rather than a single environmental score. This essay follows claims through NOAA's 2025 Report Card chapters to show how definitions, units, periods, baselines, and record lengths constrain interpretation. Sea-ice extent is distinguished from thickness and age, while daily minima and monthly averages illustrate how a correct value can be paired with an incorrect ranking. Different calendars underlie the temperature and Greenland annual assessments. Apparent contrasts, including a record-low winter maximum without a record-low summer minimum, invite explanation rather than selective quotation. The observing-network chapter also has a bounded assessment population, not universal coverage. A concise reading note preserves each finding with its place, period, method, important limit, and chapter before the headline is shared.
Say what is uncertain, precisely
Useful uncertainty communication identifies what is uncertain and what that changes. This essay separates observed quantities, their uncertainty, explanations, and policy decisions rather than allowing a vague caveat to weaken every statement. IPCC guidance supplies the distinction between confidence based on evidence and agreement and likelihood expressed as quantified uncertainty. NOAA's Greenland assessment illustrates the need to preserve measurement periods and context when comparing annual and partial-year estimates, and to distinguish reduced loss from recovery. The discussion also explains why shaded bands and plus-or-minus notation require definitions. Bounded claims about sampled places, seasons, or detections are more informative than blanket reassurance or dismissal. A decision still requires explicit consideration of consequences, affected people, and review triggers; an uncertainty interval cannot choose the policy.
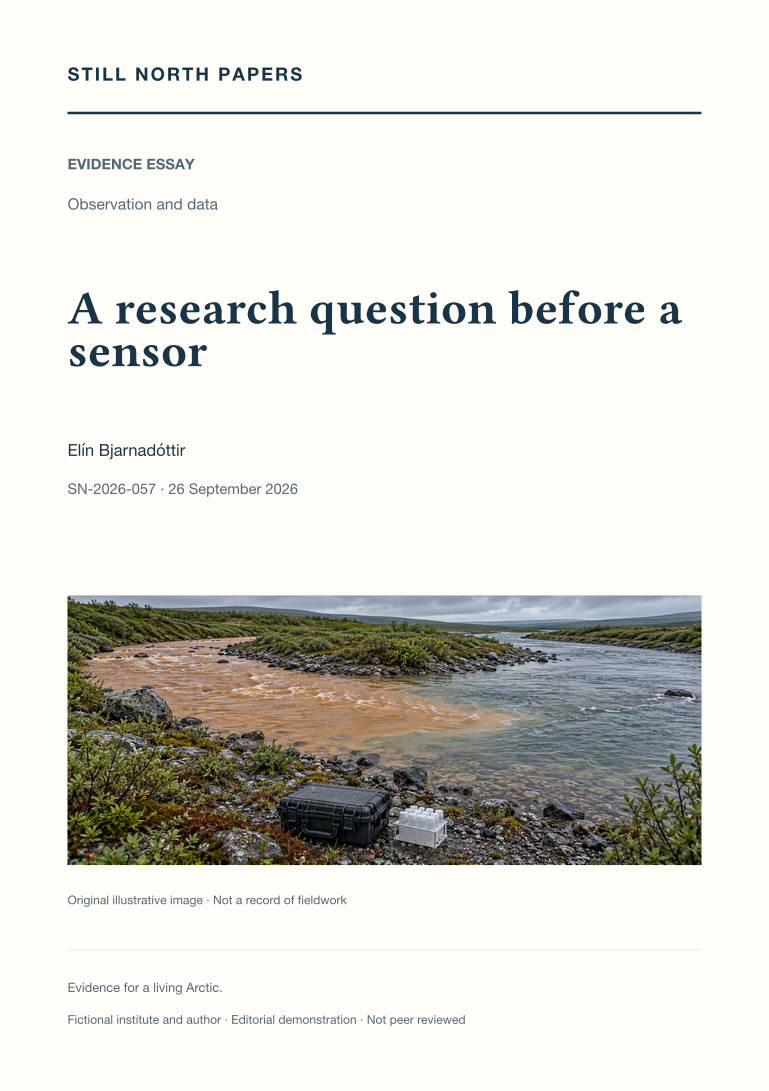
A research question before a sensor
Choosing a sensor before defining the research question can produce precise data that do not answer the original concern. This essay works backwards from a hypothetical river-colour problem to distinguish community concern, a researchable comparison, and the decision a limited study might inform. It examines competing explanations, representative locations, event timing, existing records, and plans for unsafe access or missing samples. The National Inuit Strategy on Research supplies governance context, and NOAA's network assessment illustrates why more observations at an unsuitable location do not repair every gap. Equipment selection follows the required quantity, discrimination, and coverage, with maintenance and stewardship included. Rehearsing a possible result using explicitly invented values tests whether the proposed observations could distinguish explanations without predetermining the finding.
When results make the journey home
Returning research results requires an understandable answer and continuing responsibility, not just a public download link. This essay uses a hypothetical water study to show why a local question must remain visible alongside academic interpretations and why limited samples cannot imply a comprehensive safety assessment. The National Inuit Strategy on Research places usefulness within governance and authority, while W3C guidance informs layered explanations, charts, tables, and accessible alternatives. Formats, language, timing, and correction routes should be agreed before collection, with private ways to raise questions or errors. The discussion distinguishes review from demands for favourable conclusions and protects participation from assumed recording permission. Dated summaries, retained authoritative records, and stewardship beyond the final event help keep the answer reachable after a project ends.
Open data, whose authority?
Easy downloading does not establish authority to reuse a dataset responsibly. This essay reads the National Inuit Strategy on Research as connected commitments to governance, ethics, funding, data control, and capacity, not a transferable permission checklist. A hypothetical reuse of locally shared travel knowledge shows how combining or opening information can introduce risks even when names are removed. TCPS 2 Chapter 9 adds policy context while explicitly not replacing Indigenous peoples' own guidance. The discussion connects agreed authority to repository permissions, review processes, staff handover, and differentiated release terms. It also distinguishes public availability from unrestricted ethical reuse. Useful outcomes may include locally governed information or a decision not to disclose, but those outcomes must be defined with the relevant authorities rather than claimed by outside institutions.
Consent is a conversation, not a form
Consent requires an understandable, voluntary, and continuing choice, not merely a signed form. Using a hypothetical interview about winter conditions, this essay separates participation from permission to publish recordings, locations, or quotations. Canada's TCPS 2 consent guidance informs discussion of explanation, power relationships, recruitment, compensation, and meaningful refusal, while remaining a specific policy rather than a universal legal rule. The National Inuit Strategy on Research helps distinguish individual consent, institutional approval, and collective authority without prescribing local arrangements. Changed projects and new uses may require renewed permission, and withdrawal limits must be explained before participation. The practical conclusion is operational: clear responsibilities, private records, and usable routes to pause, revise, or decline should continue after documentation has been completed.
A reproducible chart starts before the chart
A chart's source link does not preserve the decisions that produced its values. This essay explains how a reproducible public graphic begins with a defined question, comparable quantities, and an explicit analysis record. NOAA's Arctic temperature chapter illustrates the importance of geographical coverage, water-year timing, baselines, and distinct input products. A simplified baseline example separates a changed reference from a changed observation, while noting that other processing choices can also differ. The proposed compact recipe retains input versions, retrieval dates, selections, weighting, filters, completeness rules, and transformation order. Climate and Forecast history conventions support this record but do not replace explanation. Accessible tables, labelled uncertainty, and distinctions between measurements and estimates help readers recover the calculation even when they disagree with its interpretation.
Maintenance is the next observation
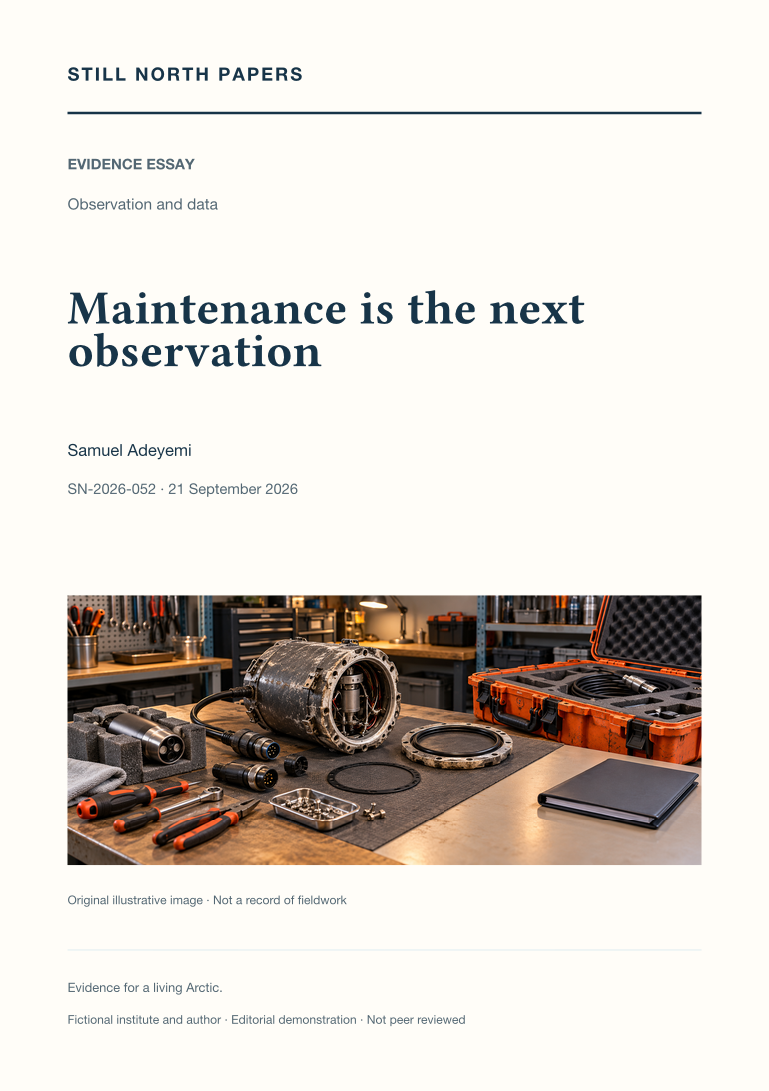
A durable observation record depends on funded maintenance, skilled people, and governed stewardship as much as on an initial sensor purchase. This essay uses a fictional station budget to identify omitted costs such as calibration, communications, processing, handover, and removal. NOAA's network assessment provides evidence for the wider importance of expertise, infrastructure, and product continuity, without serving as a live account of programme finances. Missing seasons and lost instrument overlap cannot simply be restored by buying replacement hardware. The National Inuit Strategy on Research also informs attention to priorities, capacity, and budget authority. The discussion recommends comparing contributions and dependencies openly, including responsible closure where justified. Support should sustain usable evidence, not purchase predetermined conclusions, exclusive knowledge, or unsupported claims of deployment success.
The calibration record behind a trusted number
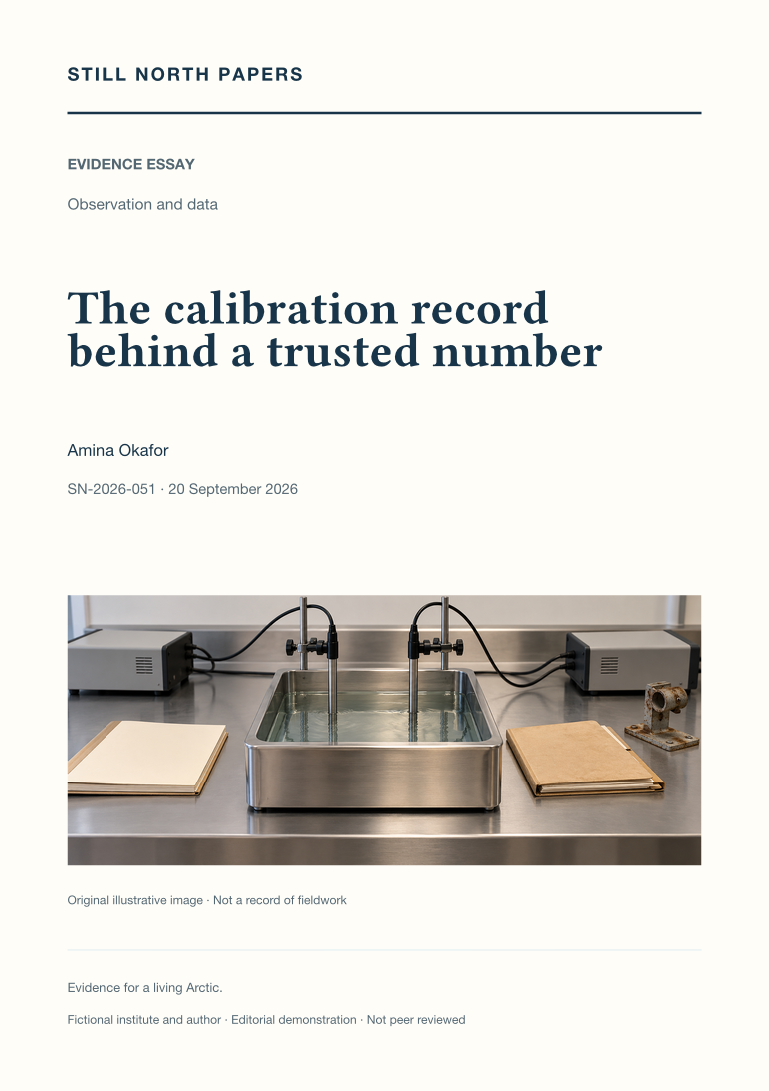
A calibration certificate characterises response under stated conditions, not the fitness of every later field value. This essay draws on NIST's traceability policy to distinguish documented reference chains from reassuring equipment labels, and calibration from adjustment. Hypothetical deployment examples show how exposure, depth, and installation can undermine representativeness even when a sensor responds correctly. Field checks, post-deployment changes, and shared biases require explicit limits rather than assumed histories of gradual drift. NOAA's observing-network assessment supplies context for transitions between instruments and the value of comparable overlap. The practical recommendation is to preserve raw values, reference details, conditions, uncertainty contributions, correction parameters, and method versions. A trusted number is one whose measurement and correction history a future researcher can reconstruct for its intended use.
Missing observations are not zeroes
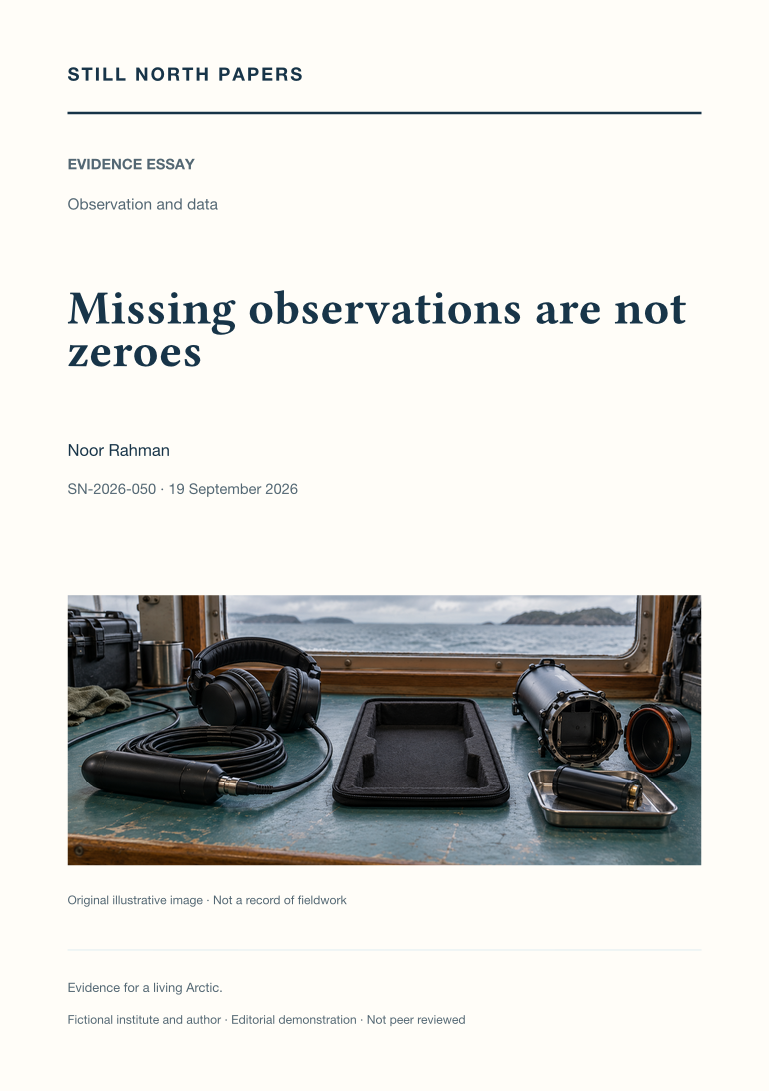
A missing observation, a usable recording with no detections, and a signal obscured by noise support different conclusions. This essay uses hypothetical acoustic records to distinguish counts from effort-adjusted rates and to show why downtime must not become successful listening. It draws on Climate and Forecast conventions to discuss missing-value codes and separate quality flags, including the care needed for values below reporting limits. NOAA's observing-network assessment supplies context for uneven seasonal and spatial coverage. When gaps depend on weather or access, the remaining record may not represent the full conditions of interest. The practical recommendation is to preserve reasons for absence, coverage rules, method changes, and visible chart gaps, while distinguishing estimated values from measurements and never treating zero detections as proof of animal absence.
Metadata that outlives an instrument
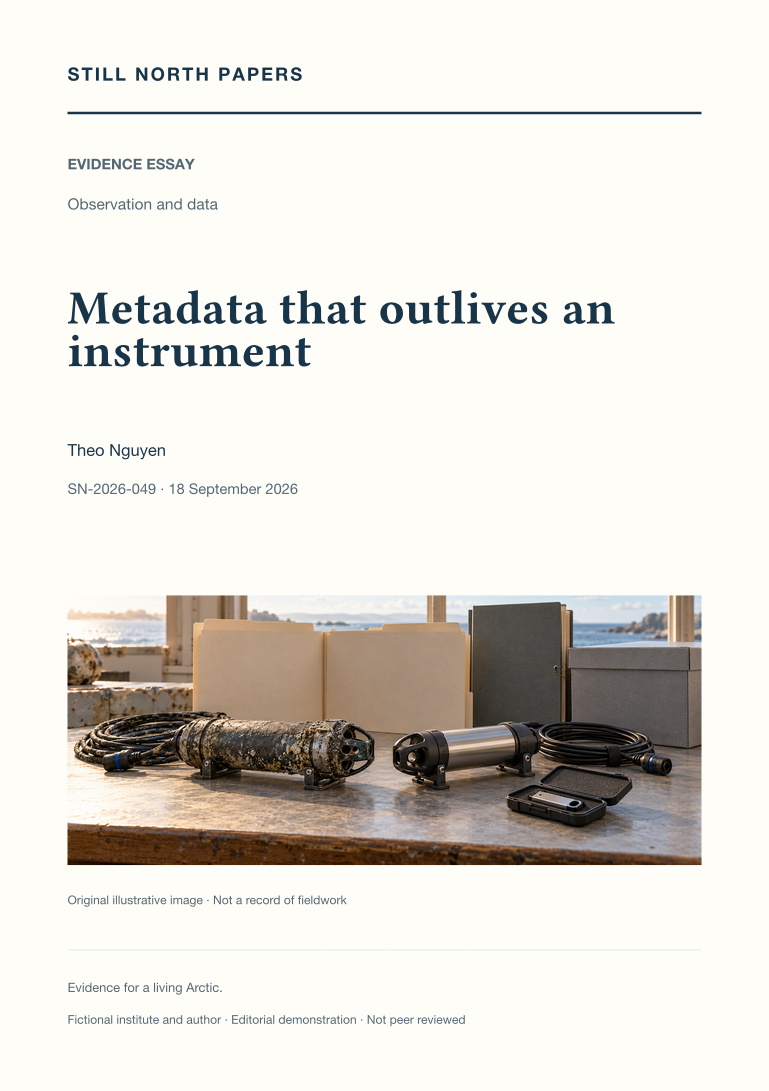
Measurements can survive while the context needed to interpret them disappears. This essay identifies metadata that preserves comparability, reproducibility, and permission to use a record. A fictional temperature-logger replacement illustrates how altered sampling intervals can change an analysis unless deployment and aggregation choices remain explicit. Climate and Forecast conventions provide an existing language for quantities, coordinates, units, and history, complemented by separate deployment and processing logs. NOAA's observing-network assessment supplies wider context for sensor transitions and recalibration. The discussion recommends retaining original observations, versioned products, documented corrections, access conditions, and an institutional stewardship role. Complete documentation is not equated with unrestricted publication. A practical handover exercise asks whether an unfamiliar reader can explain one published value using the archive alone, without relying on someone's memory.
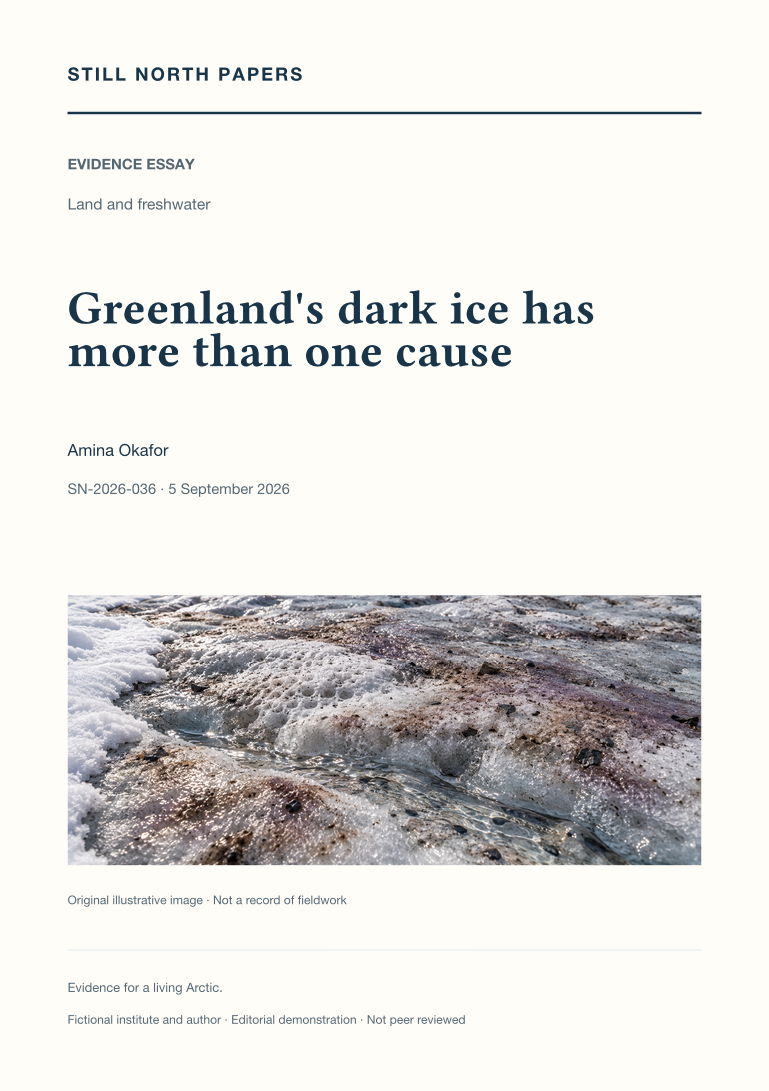
Greenland's dark ice has more than one cause
Dark Greenland ice can reflect snow retreat, light-absorbing material, glacier algae, water, and changing surface texture. This essay separates observed colour, attribution of reflectivity changes, and consequences for melt. NOAA's Greenland assessment provides seasonal context, while a western Greenland study illustrates how biological sampling, radiation measurements, and aerial observations constrain the contribution of algae alongside the physical weathering crust. Neither source makes every dark patch biologically equivalent. The discussion explains why a satellite pixel can miss small algal patches and why a selected ground measurement may not represent the wider footprint. Its central implication is methodological: compatible scales, timing, and illumination are needed before linking surface appearance to mechanisms or melt, and local findings cannot be expanded into an ice-sheet-wide total without further evidence.
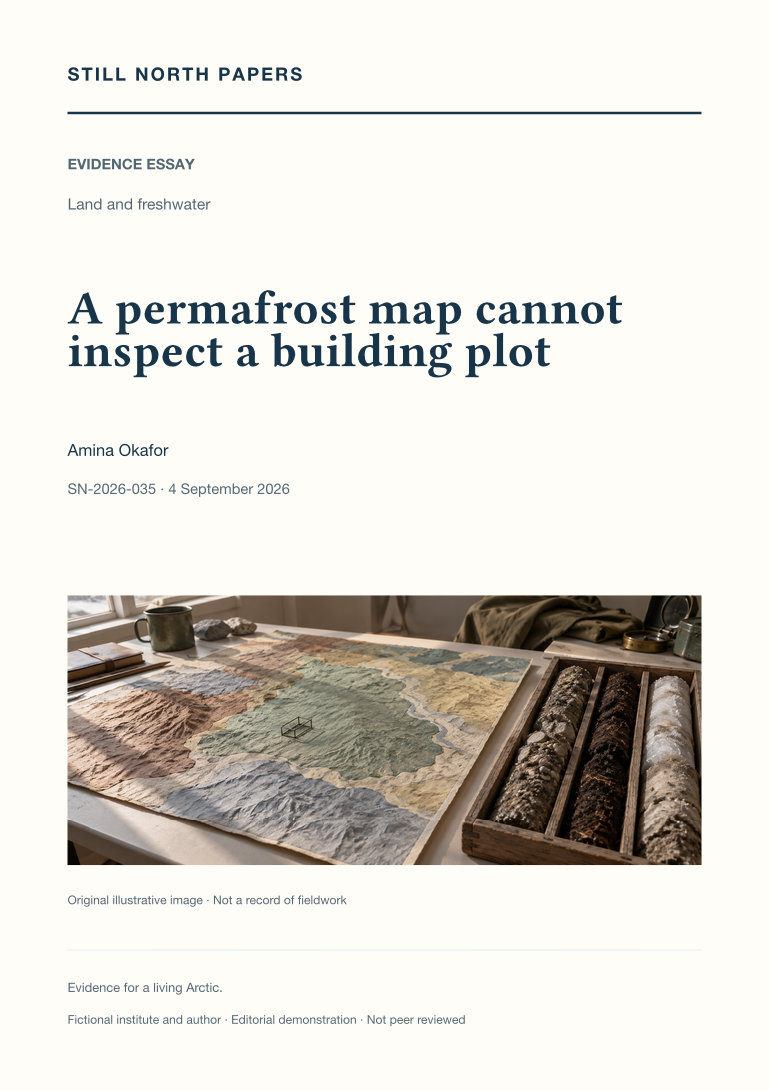
A permafrost map cannot inspect a building plot
Regional permafrost maps provide context, not inspections of individual building plots. This essay reads the Circum-Arctic Map of Permafrost and Ground-Ice Conditions to separate mapped extent classes from parcel-level probabilities and ground-ice abundance from the thermal definition of permafrost. It explains why zooming, resampling, or displaying sharper boundaries cannot add evidence absent from the original map. Production scale, historical observations, release dates, and the meanings of blank areas all constrain interpretation. Local snow, surface conditions, and materials further limit direct transfer from a regional class to a particular site. The practical outcome is a concise reporting approach that names dataset, version, property, scale, methods, and limits. Actual foundation decisions remain dependent on competent site-specific investigation, not a colour selected on screen.
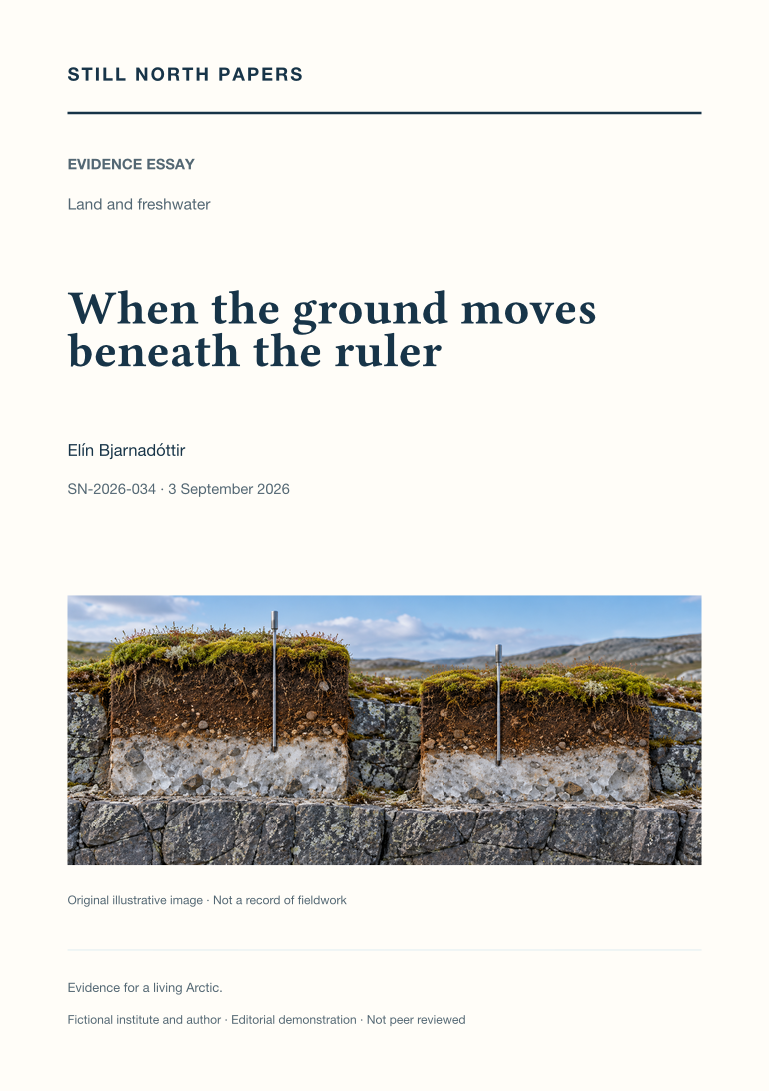
When the ground moves beneath the ruler
An unchanged thaw-depth reading can conceal movement of both the ground surface and the thaw boundary. Through a deliberately simplified example, this essay distinguishes surface-relative depth from elevation measured against an external reference. It draws on active-layer monitoring guidance to discuss marked sampling locations, repeat readings, probe refusal, lower bounds, and the importance of recording seasonal timing. A cited satellite-radar study extends the discussion to spatial observations without equating radar displacement with a thaw probe. Seasonal heave and subsidence must also be separated from persistent settlement before comparisons are interpreted. The essay recommends preserving linked records of depth, surface movement, point identity, reference conventions, and method changes, while making clear that no particular site's subsidence is established by the explanation.
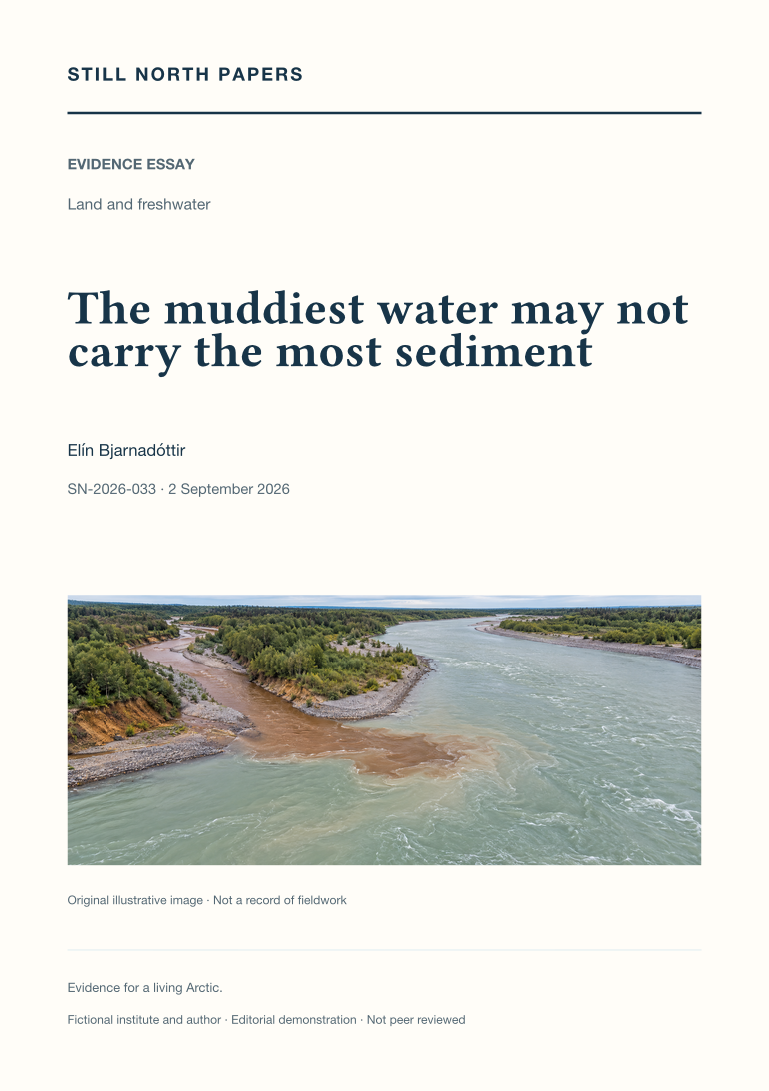
The muddiest water may not carry the most sediment
Muddy appearance describes neither the full quantity of sediment transported nor its ecological consequences. This essay distinguishes suspended-sediment concentration, instantaneous mass flux, and load accumulated over time, using a hypothetical comparison in which the clearer stream transports more material. It examines event timing, changing sediment supply, and differences between rising and falling flows that can undermine a single concentration–discharge relationship. A published USGS river investigation supplies a methodological example, not an Arctic estimate. The discussion also explains why turbidity requires locally supported conversion relationships and why sampling position matters. Its practical recommendation is to retain discharge, sampling time, representative methods, and estimation periods with sediment results, while keeping transport separate from claims about contamination, drinking-water suitability, or ecological damage.
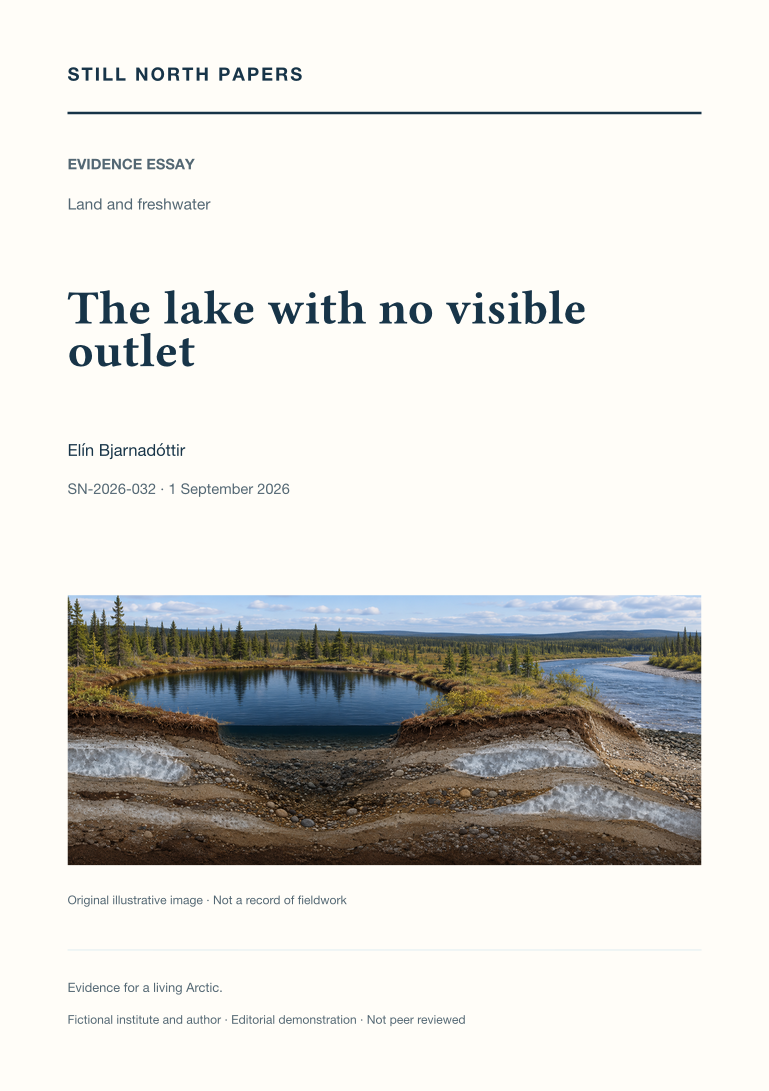
The lake with no visible outlet
A lake without a mapped surface outlet can still exchange water through seasonal floods or subsurface pathways. This essay uses published Yukon Flats research to distinguish observed lake-area change from inferred hydrological connectivity. It explains how permafrost distribution, sediment permeability, and changing water levels influence possible routes, while a shrinking shoreline can reflect several competing changes in the water balance. The account of Twelvemile Lake shows why flood recharge and longer records can alter an interpretation based on isolated images. A hypothetical comparison of neighbouring lakes illustrates the additional evidence needed to separate shared rainfall from direct exchange. The discussion concludes that connectivity must be specified by timing, direction, duration, and purpose rather than treated as a permanent line on a map.
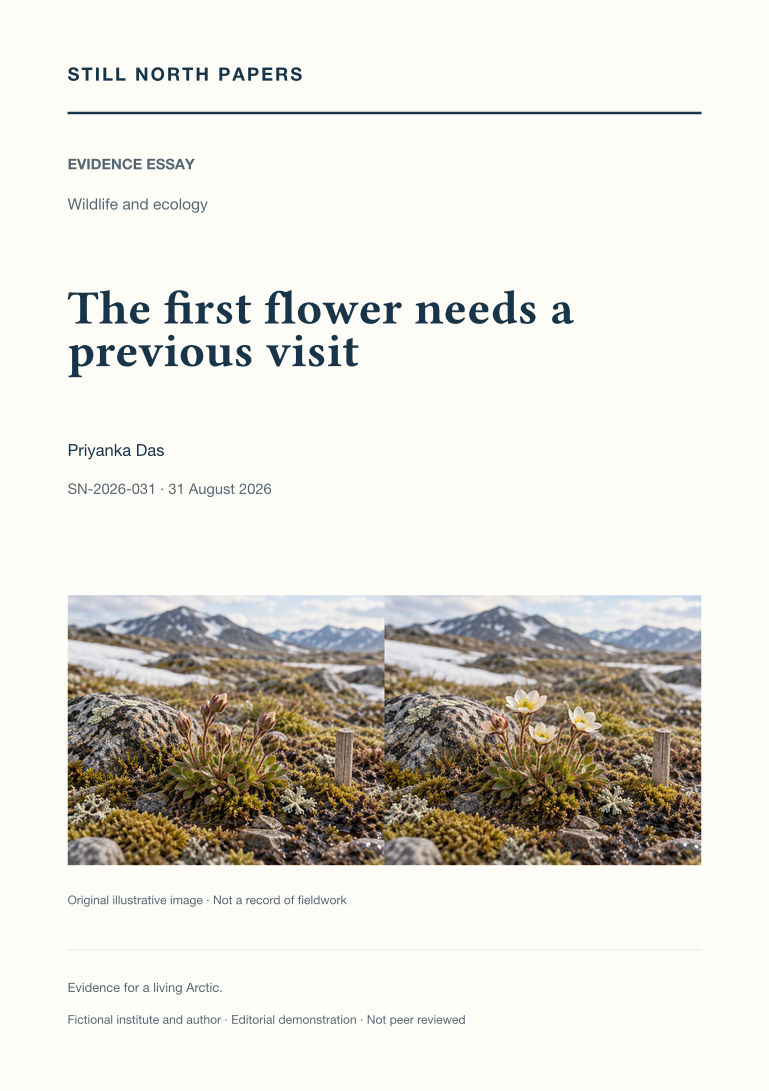
The first flower needs a previous visit
A first flowering detection identifies a visit, not necessarily the day flowering began. This essay explains how repeated positive, negative, and uncertain observations bound onset, using an explicitly illustrative sequence rather than a field result. It distinguishes a consistently monitored plant or patch from an expanding search area, and separates first flowering, peak abundance, and duration. Snow conditions and observation frequency can affect apparent timing, so changes in detection require interpretation before they become claims of biological change. Drawing on USA National Phenology Network documentation, the discussion also shows why a proposed flower–pollinator mismatch needs adequate records of both organisms. Its practical conclusion is to preserve visit intervals, stage definitions, search effort, and missing coverage alongside the reported dates.
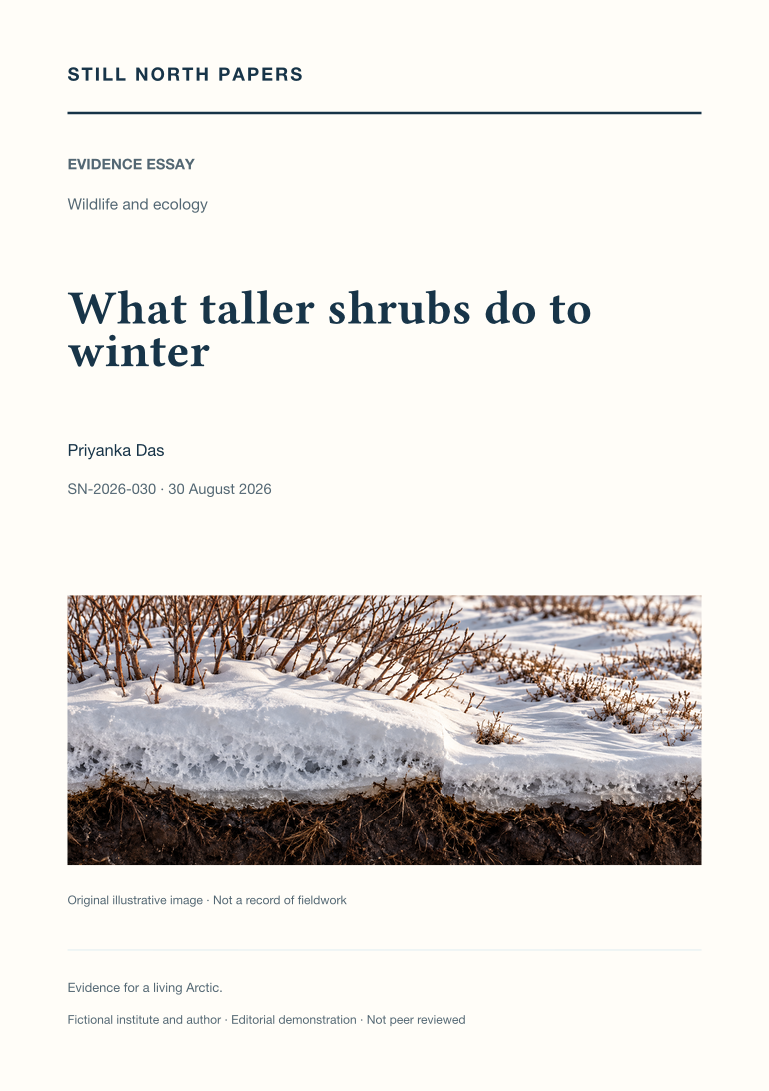
What taller shrubs do to winter
Taller tundra shrubs are followed through winter snow, spring radiation, and summer soil conditions rather than assigned one warming or cooling effect. Published Bylot Island observations show how shrub-associated snow depth, density, conductivity, and melt can change insulation in competing ways. Their winter simulations remain explicitly seasonal, not annual forecasts for Arctic permafrost. A separate Siberian vegetation comparison illustrates why lower surface albedo can coexist with a shallower active layer when soil and moisture conditions differ, without proving the effect of replacing one vegetation type with another. The essay proposes matched observations of vegetation, snow structure, soil temperature, moisture, and thaw across comparable terrain. Its implication is to retain the cold season and ground properties when interpreting a visible change in summer vegetation.
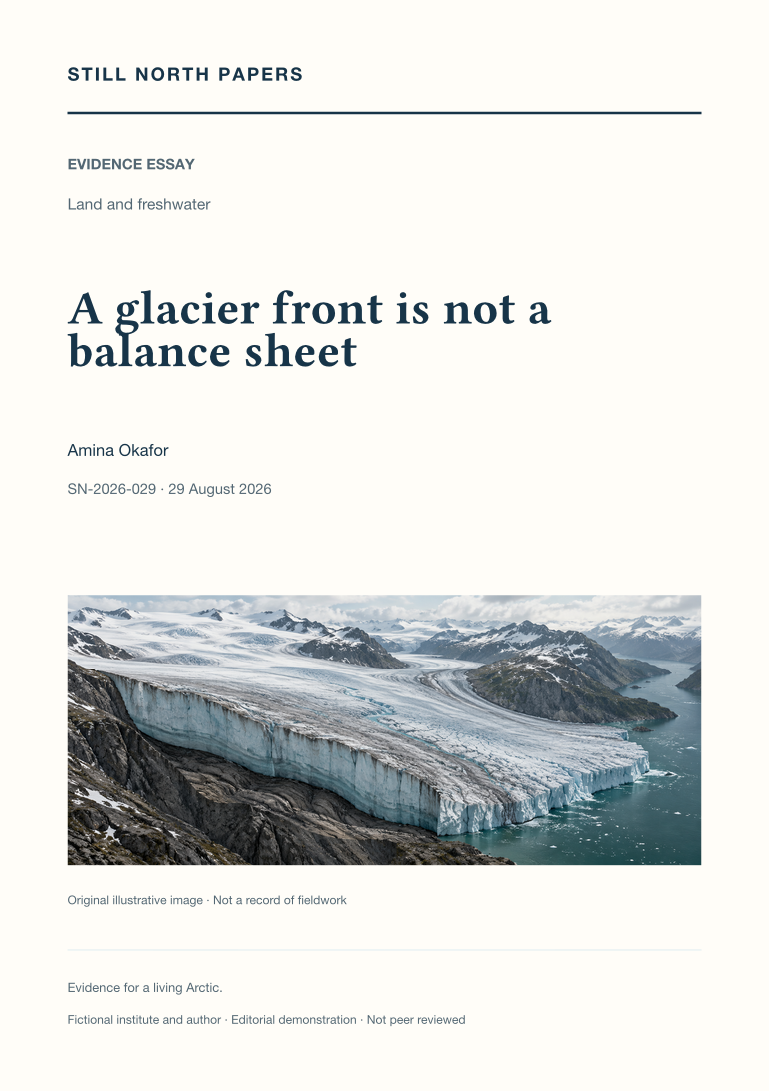
A glacier front is not a balance sheet
A glacier's terminus, velocity, surface height, and total mass are examined as related but non-interchangeable measures. Hypothetical examples show how a nearly stationary front can coexist with upstream thinning, or an advancing tongue with redistribution rather than sustained mass gain. The essay distinguishes surface balance from total balance, retaining refreezing and discharge within the appropriate accounting boundaries. Greenland's published 2025 assessment provides a concrete case of reduced annual loss that remains net loss, with its period and uncertainty intact. Gravimetry, altimetry, and input-output methods are compared by what they measure and omit, including discharge-gate boundaries. Image timing and geolocation also matter to retreat claims. The conclusion matches each question to its measurement instead of making one dramatic front photograph represent the whole ice sheet.